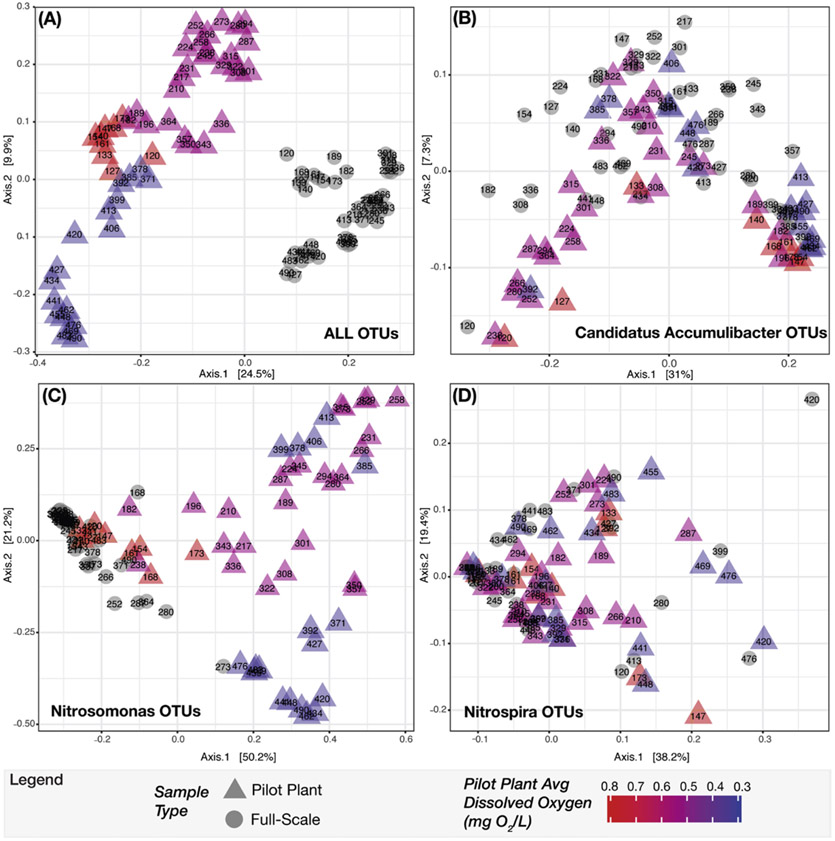
Figure 8.
Principle coordinate analysis (PCoA) ordination of next-generation sequence data comparing sample composition between full-scale and pilot-scale plants using Bray-Curtis dissimilarity matrices. Full-scale samples and pilot plant samples are represented as circles and triangles, respectively. The sample label represents the day of pilot plant operation that the sample was collected. The color gradient denotes the average DO for the pilot plant samples during each operational phase. (A) PCoA with all OTUs from the rarefied and filtered dataset considered. (B) PCoA with OTUs classified as the genera Candidatus Accumulibacter, and with relative abundance calculated using only the total number of reads in the Ca. Accumulibacter specific OTUs. (C) PCoA with relative abundance calculated using only the Nitrosomonas specific OTUs. (D) PCoA with relative abundance calculated using only the Nitrospira specific OTUs. (For interpretation of the references to colour in this figure legend, the reader is referred to the web version of this article.)

