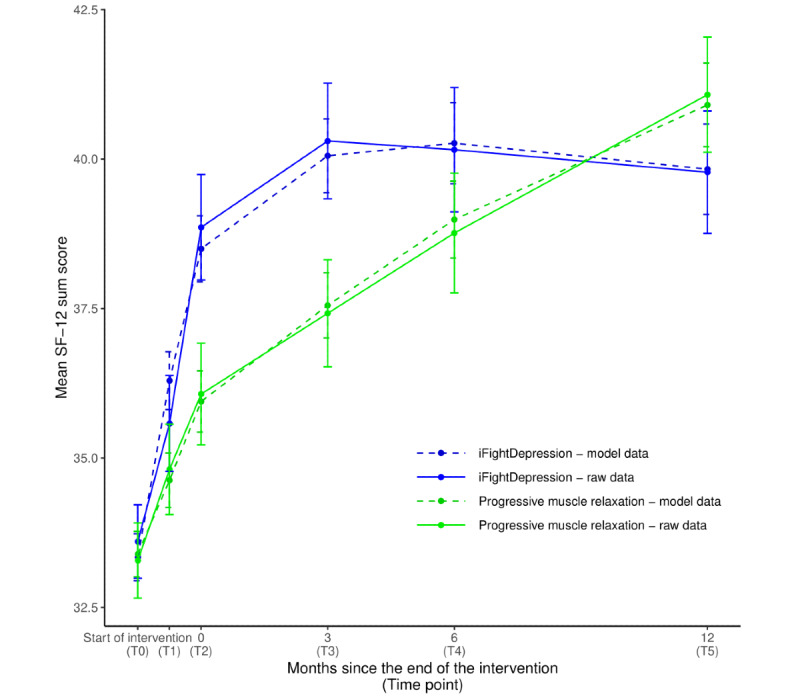
Figure 3.

Changes over time in mean SF-12. Points of measurement: T0: before the intervention; T1: after 3 weeks of intervention; T2: after intervention period; T3 to T5: follow-up measurements after 3, 6, and 12 months; error bars: standard errors of the mean; and SF-12: Short-Form 12 (mental component score). Model results refer to the estimates of the base model including fixed effects for time x group and time x time + group.
