. 2020 Jul 14;8(7):e17891. doi: 10.2196/17891
©Abigail R Greenleaf, Aliou Gadiaga, Yoonjoung Choi, Georges Guiella, Shani Turke, Noelle Battle, Saifuddin Ahmed, Caroline Moreau. Originally published in JMIR mHealth and uHealth (http://mhealth.jmir.org), 14.07.2020.
This is an open-access article distributed under the terms of the Creative Commons Attribution License (https://creativecommons.org/licenses/by/4.0/), which permits unrestricted use, distribution, and reproduction in any medium, provided the original work, first published in JMIR mHealth and uHealth, is properly cited. The complete bibliographic information, a link to the original publication on http://mhealth.jmir.org/, as well as this copyright and license information must be included.
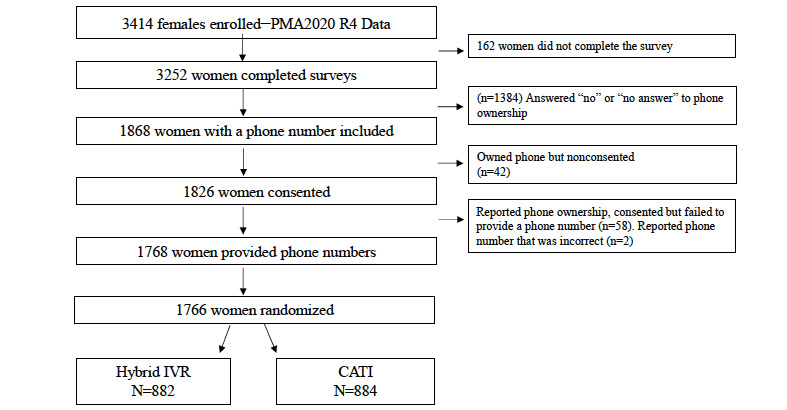
Figure 1.

Study enrollment flow chart.
