
Figure 3: Validation of Serpina3n upregulation by APOE4 and microglia activation by aging in the brain of apoE-TR mice.
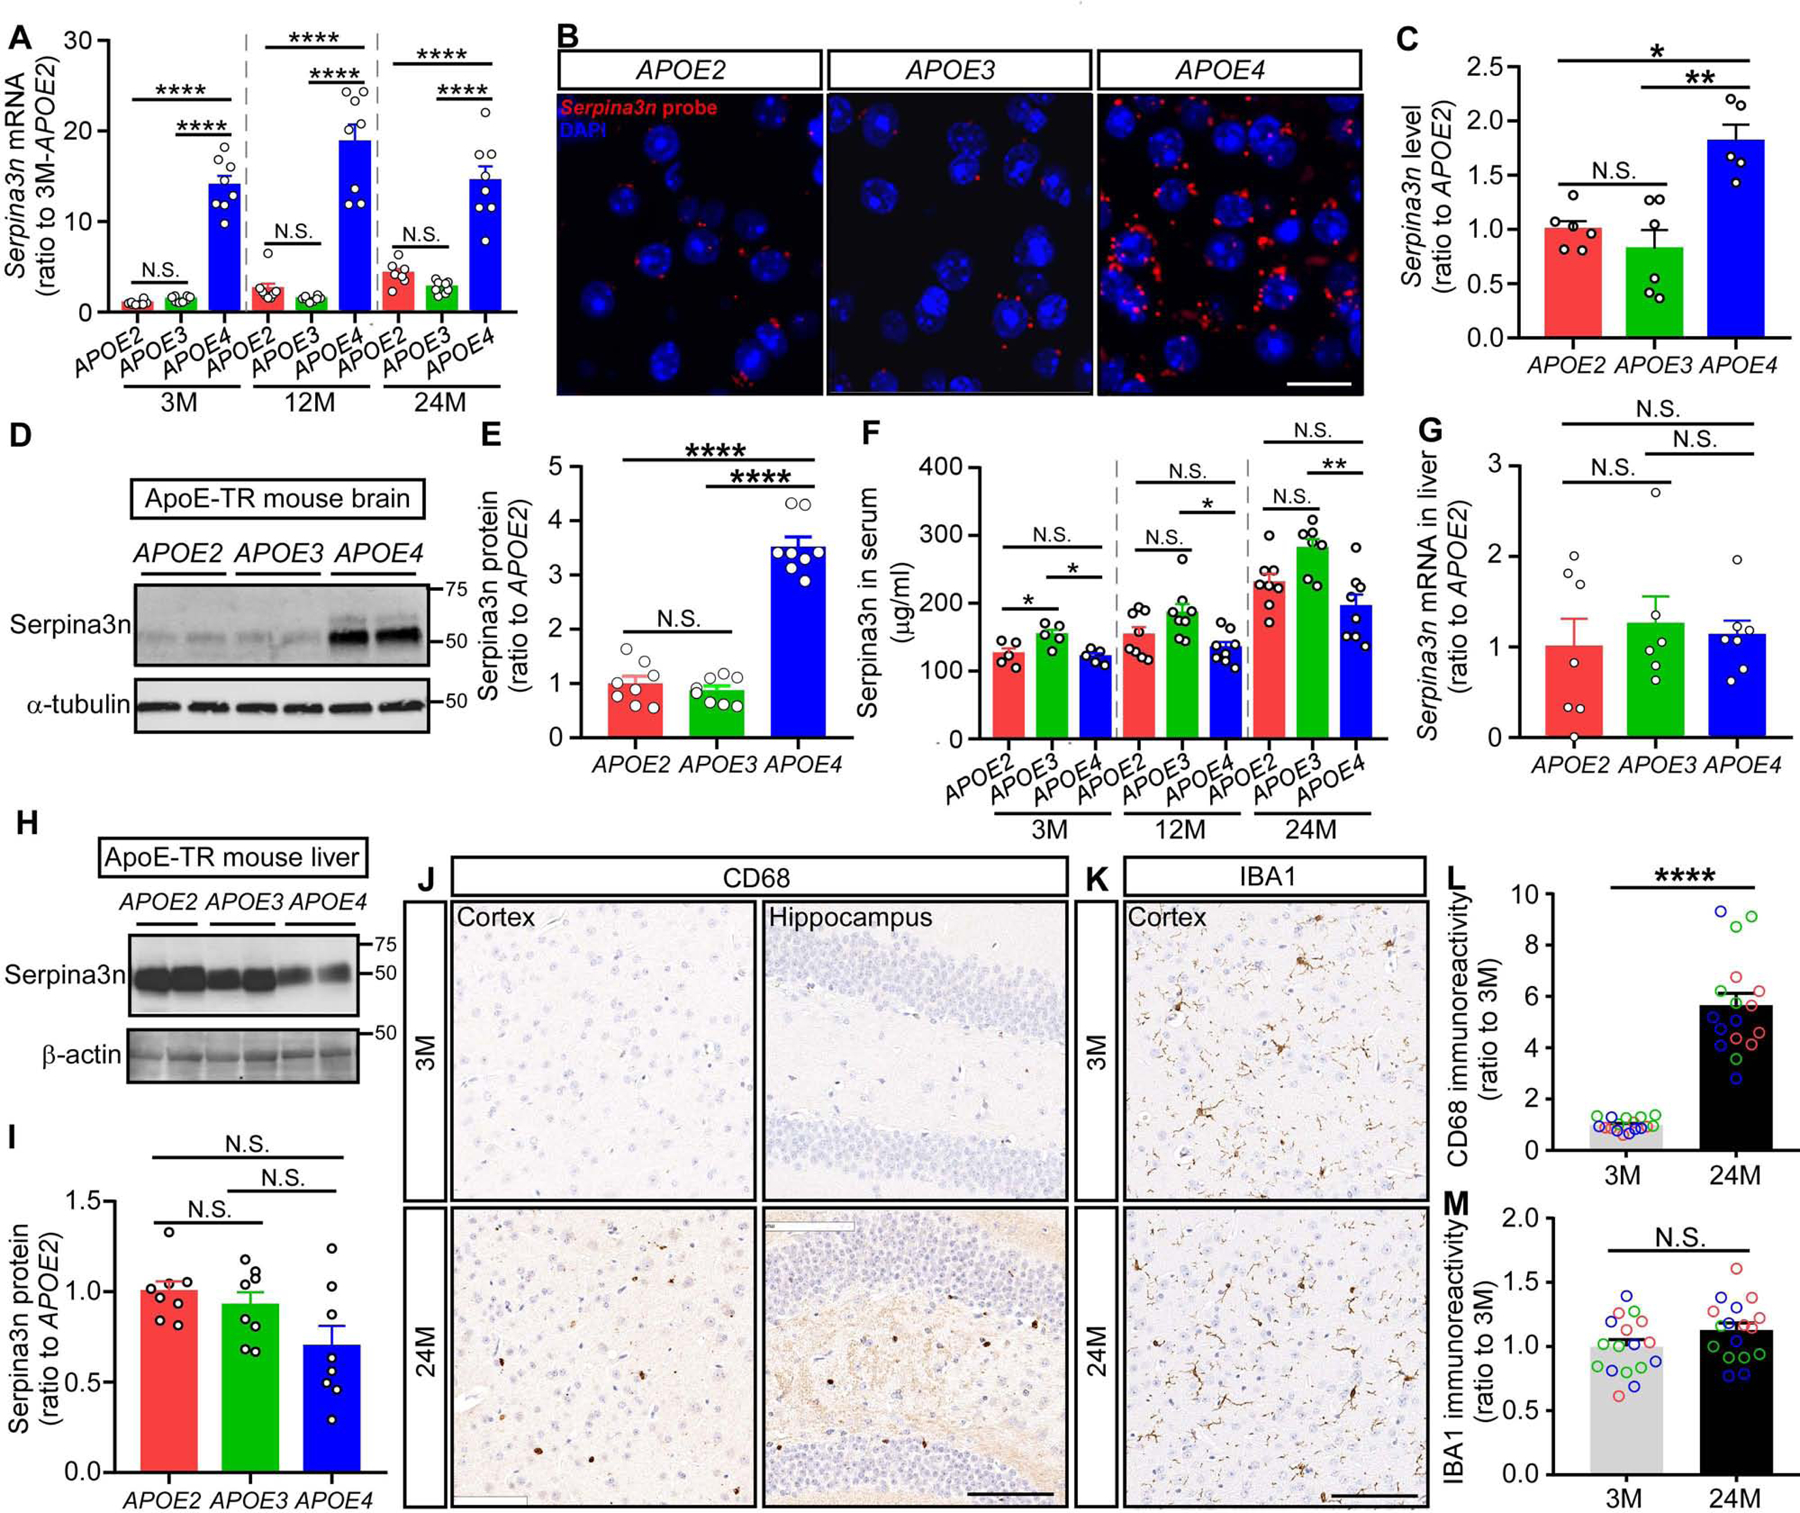
(A) The expression of Serpina3n at the mRNA level was detected by qPCR using RNA samples from the cortex of apoE-TR mice at different ages (n = 7–8 mice per APOE genotype per age group, mixed gender). Data are expressed as mean ± SEM relative to APOE2 mice at 3 months of age. One-way ANOVA was used to detect differences among APOE genotypes within each age group. (B and C) Brain sections were prepared from the apoE-TR mice (n = 5–6 mice per APOE genotype, mixed gender). The expression of Serpinas3n was visualized using RNAscope probes while nuclei were visualized with DAPI. Representative images were shown from each APOE genotype, respectively. Scale bar: 20 μm. The intensity of Serpina3n staining was quantified using ImageJ software and compared among APOE genotypes using one-way ANOVA. (D and E) Proteins from the cortex of apoE-TR mice were extracted using RIPA buffer. Serpina3n level was examined by Western blotting (n = 8 mice per group, mixed gender). Results were normalized to α-tubulin expression. Data are expressed as mean ± SEM relative to APOE2 mice. One-way ANOVA tests were used. (F) Serpina3n in the serum of apoE-TR mice was examined by ELISA (n = 5 mice per APOE genotype at 3 months of age, n = 7–8 mice per APOE genotype at 12 and 24 months of age, mixed gender). One-way ANOVA tests were used to detect difference among APOE genotypes within each age group. (G-I) The expression of Serpina3n at the mRNA and protein levels was evaluated in the liver of apoE-TR mice at 24 months of age by qPCR (G) or Western blotting (H and I) (n = 5–6 mice per group, mixed gender, RIPA fraction was used for the Western blotting experiment). The immunoblotting results were normalized to β-actin expression. Data are expressed as mean ± SEM relative to APOE2 mice. One-way ANOVA tests were used. (J-M) Brain sections were prepared from the apoE-TR mice at 3 and 24 months of age. Representative images are shown for the CD68 (J) and IBA1 (K) immunohistochemical staining at different brain regions. Scale bar, 100 μm. The immunoreactivity of CD68 (L) and IBA1 (M) staining in the region of cortex was evaluated by Aperio ImageScope (n = 17–18 mice per age group, mixed APOE genotype and gender). Red, green, and blue circles represent APOE2, APOE3 and APOE4 genotype, respectively. Data represent mean ± SEM relative to 3-month-old mice. Mann-Whitney tests were used. *p < 0.05; **p < 0.01; ****p < 0.0001; N.S., not significant.