
Figure 5: Differential gene expression and pathway analyses of the mouse brain transcriptomes.
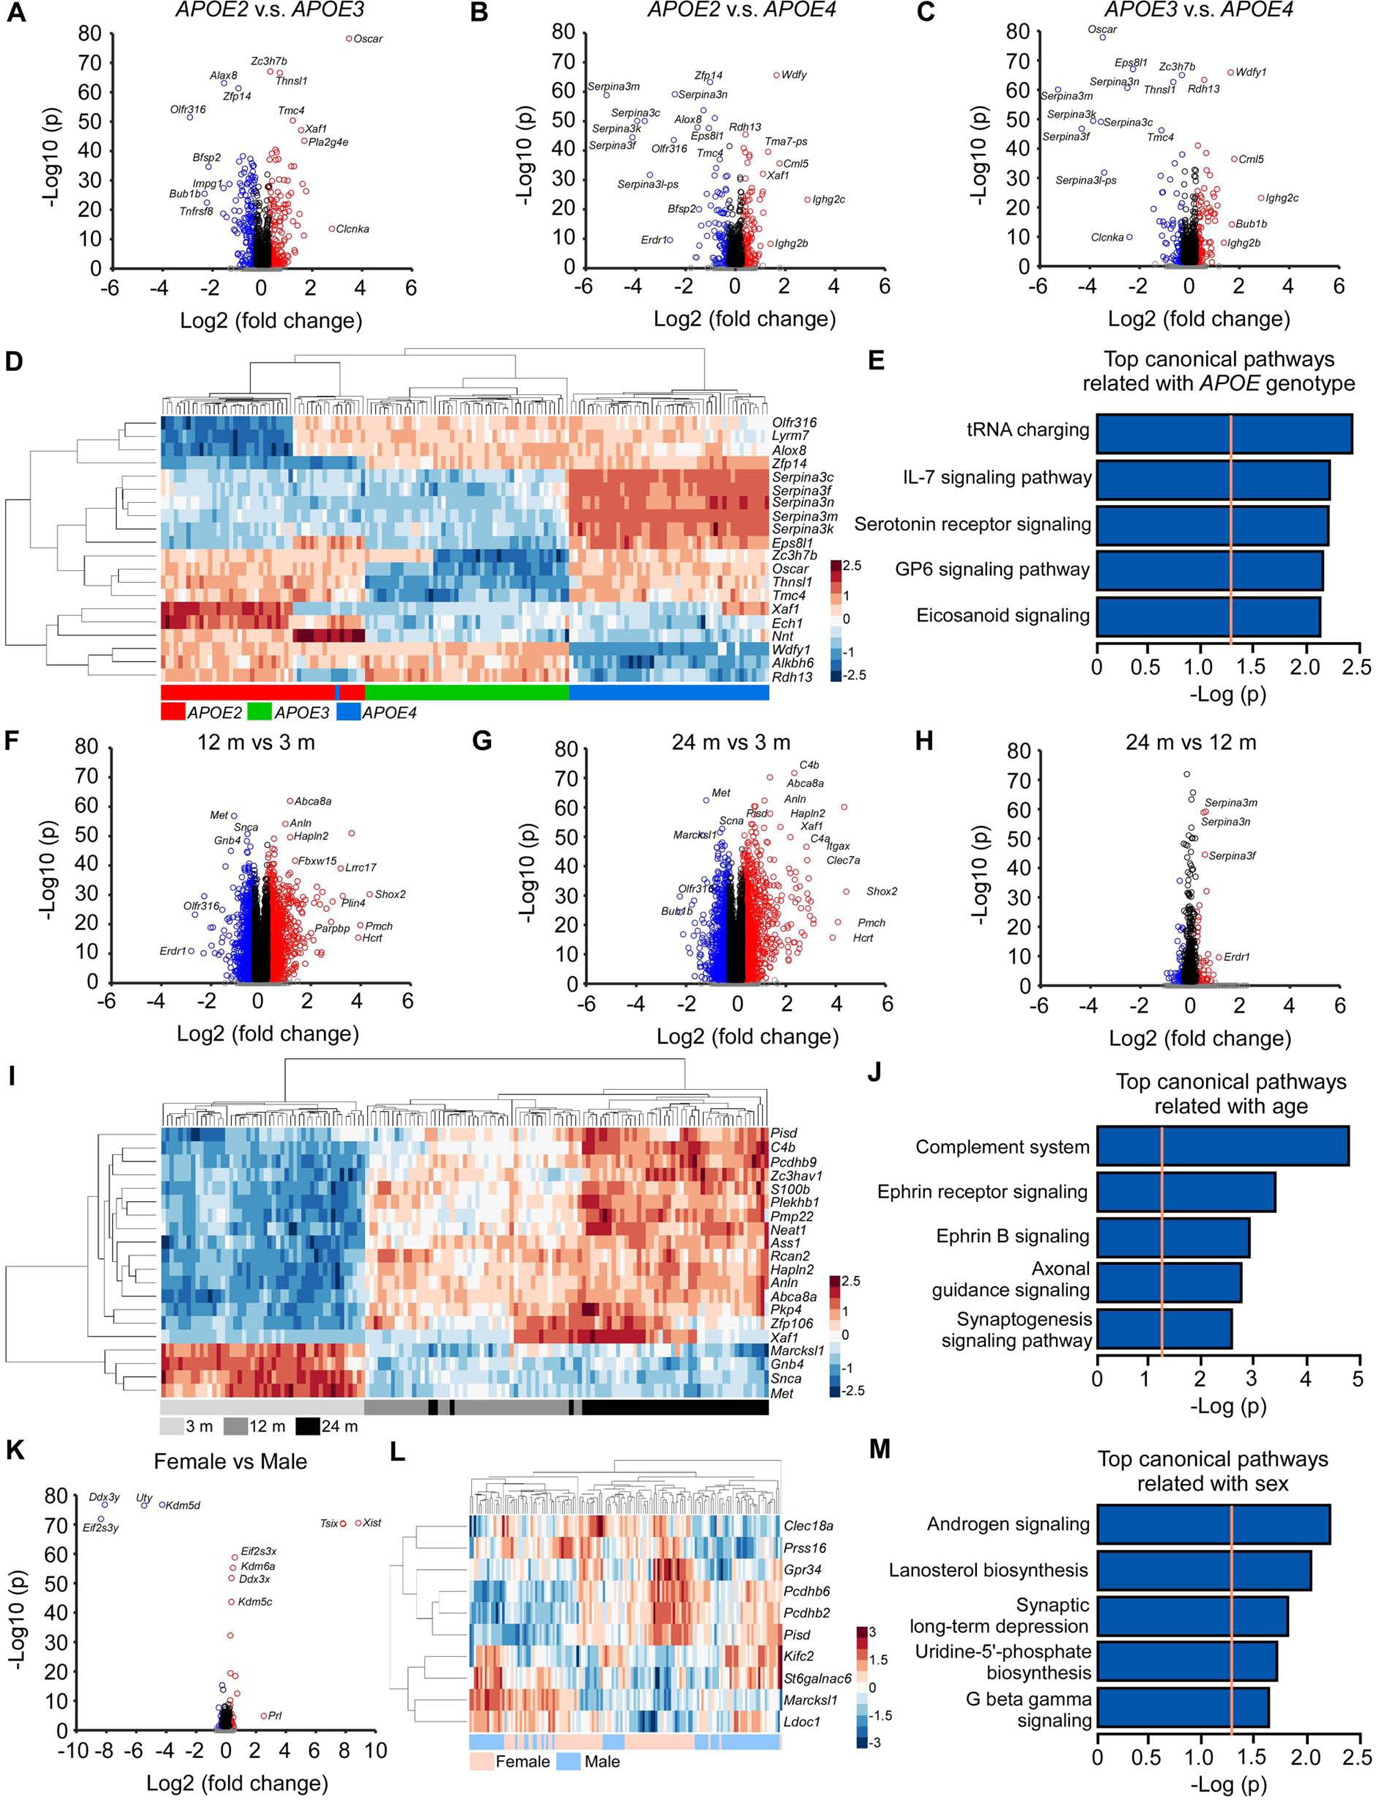
(A-C) Volcano plots of DEGs identified between the APOE2 and APOE3 (A), APOE2 and APOE4 (B), and APOE3 and APOE4 genotypes (C). The blue circles denote downregulated DEGs and the red circles denote upregulated DEGs in each comparison (Bonferroni-corrected p < 0.05 and |fold change| ≥ 1.2). The black circles denote genes with significant p values (Bonferroni-corrected p < 0.05) but |fold change| < 1.2, and the grey dots denote genes that did not meet either the p value or the fold change threshold. (D) Hierarchical clustering of the top 20 DEGs affected by APOE genotypes (Bonferroni-corrected p < 0.05). Each row corresponds to one gene and each column corresponds to one sample. (E) The top 5 pathways enriched by 1,011 DEGs affected by APOE genotypes (Bonferroni-corrected p < 0.0001). The orange dotted line indicates the threshold of p = 0.05. (F-H) Volcano plots of DEGs identified between the 12 and 3 months (F), 24 and 3 months (G), and 24 months and 12 months old mice (H). The color code of the circles is identical to figures A-C. (I) Hierarchical clustering of the top 20 DEGs affected by age (Bonferroni-corrected p < 0.05). (J) The top 5 canonical pathways enriched by the top 1,000 DEGs affected by age. (K) Volcano plot of DEGs identified between female and male mice. The color code of the circles is identical to figures A-C. (L) Hierarchical clustering of the top 10 DEGs affected by sex (the X- and Y-linked genes were excluded). (M) The top 5 pathways enriched by 102 DEGs affected by sex (Bonferroni-corrected p < 0.0001). N = 7–8 mice/genotype/age/sex.