
Figure 6: Impact of APOE genotype, age and sex on co-expression network of the mouse serum metabolomes.
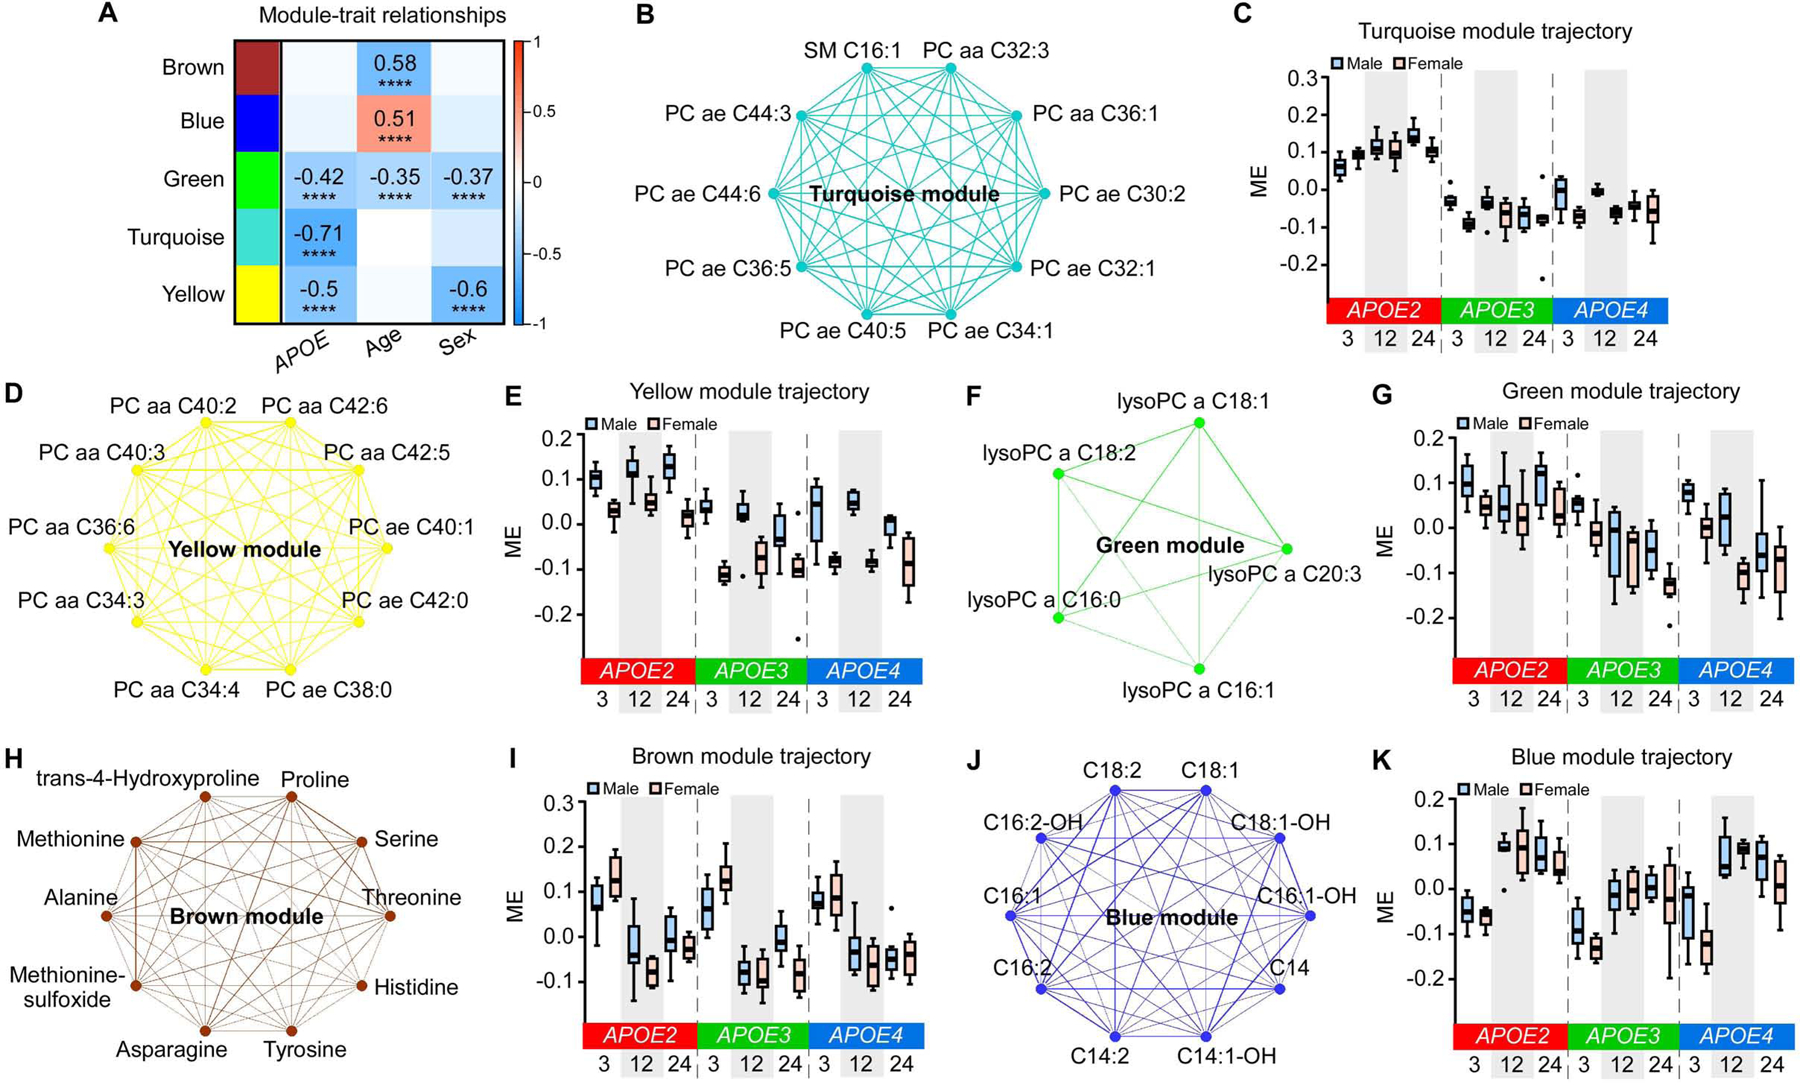
(A) The correlation between MEs and APOE genotype, age, and sex. The values in the heatmap are Pearson’s correlation coefficients. Stars represent significant correlations: ****p < 0.0001. Modules with positive values (orange) indicate positive correlation of MEs with APOE4 genotype, older age, or female; modules with negative values (blue) indicate negative correlation of MEs with these traits. (B, D, F, H, and J) Network plots of the top 10 hub metabolites in the turquoise (B), yellow (D), green (F, only 5 metabolites in the module), brown (H), and blue (J) modules. (C, E, G, I, and K) MEs in the turquoise (C), yellow (E), green (G), brown (I), and blue (K) modules across different APOE genotypes (APOE2, APOE3, and APOE4), ages (3, 12, and 24 months), and sexes (male and female). The upper and lower lines in the boxplots represent the maximum and minimum values after Tukey’s test. The center line represents the median. N = 7–8 mice/genotype/age/sex.