
Figure 7: Differentially expressed metabolites (DEMs) in the mouse serum.
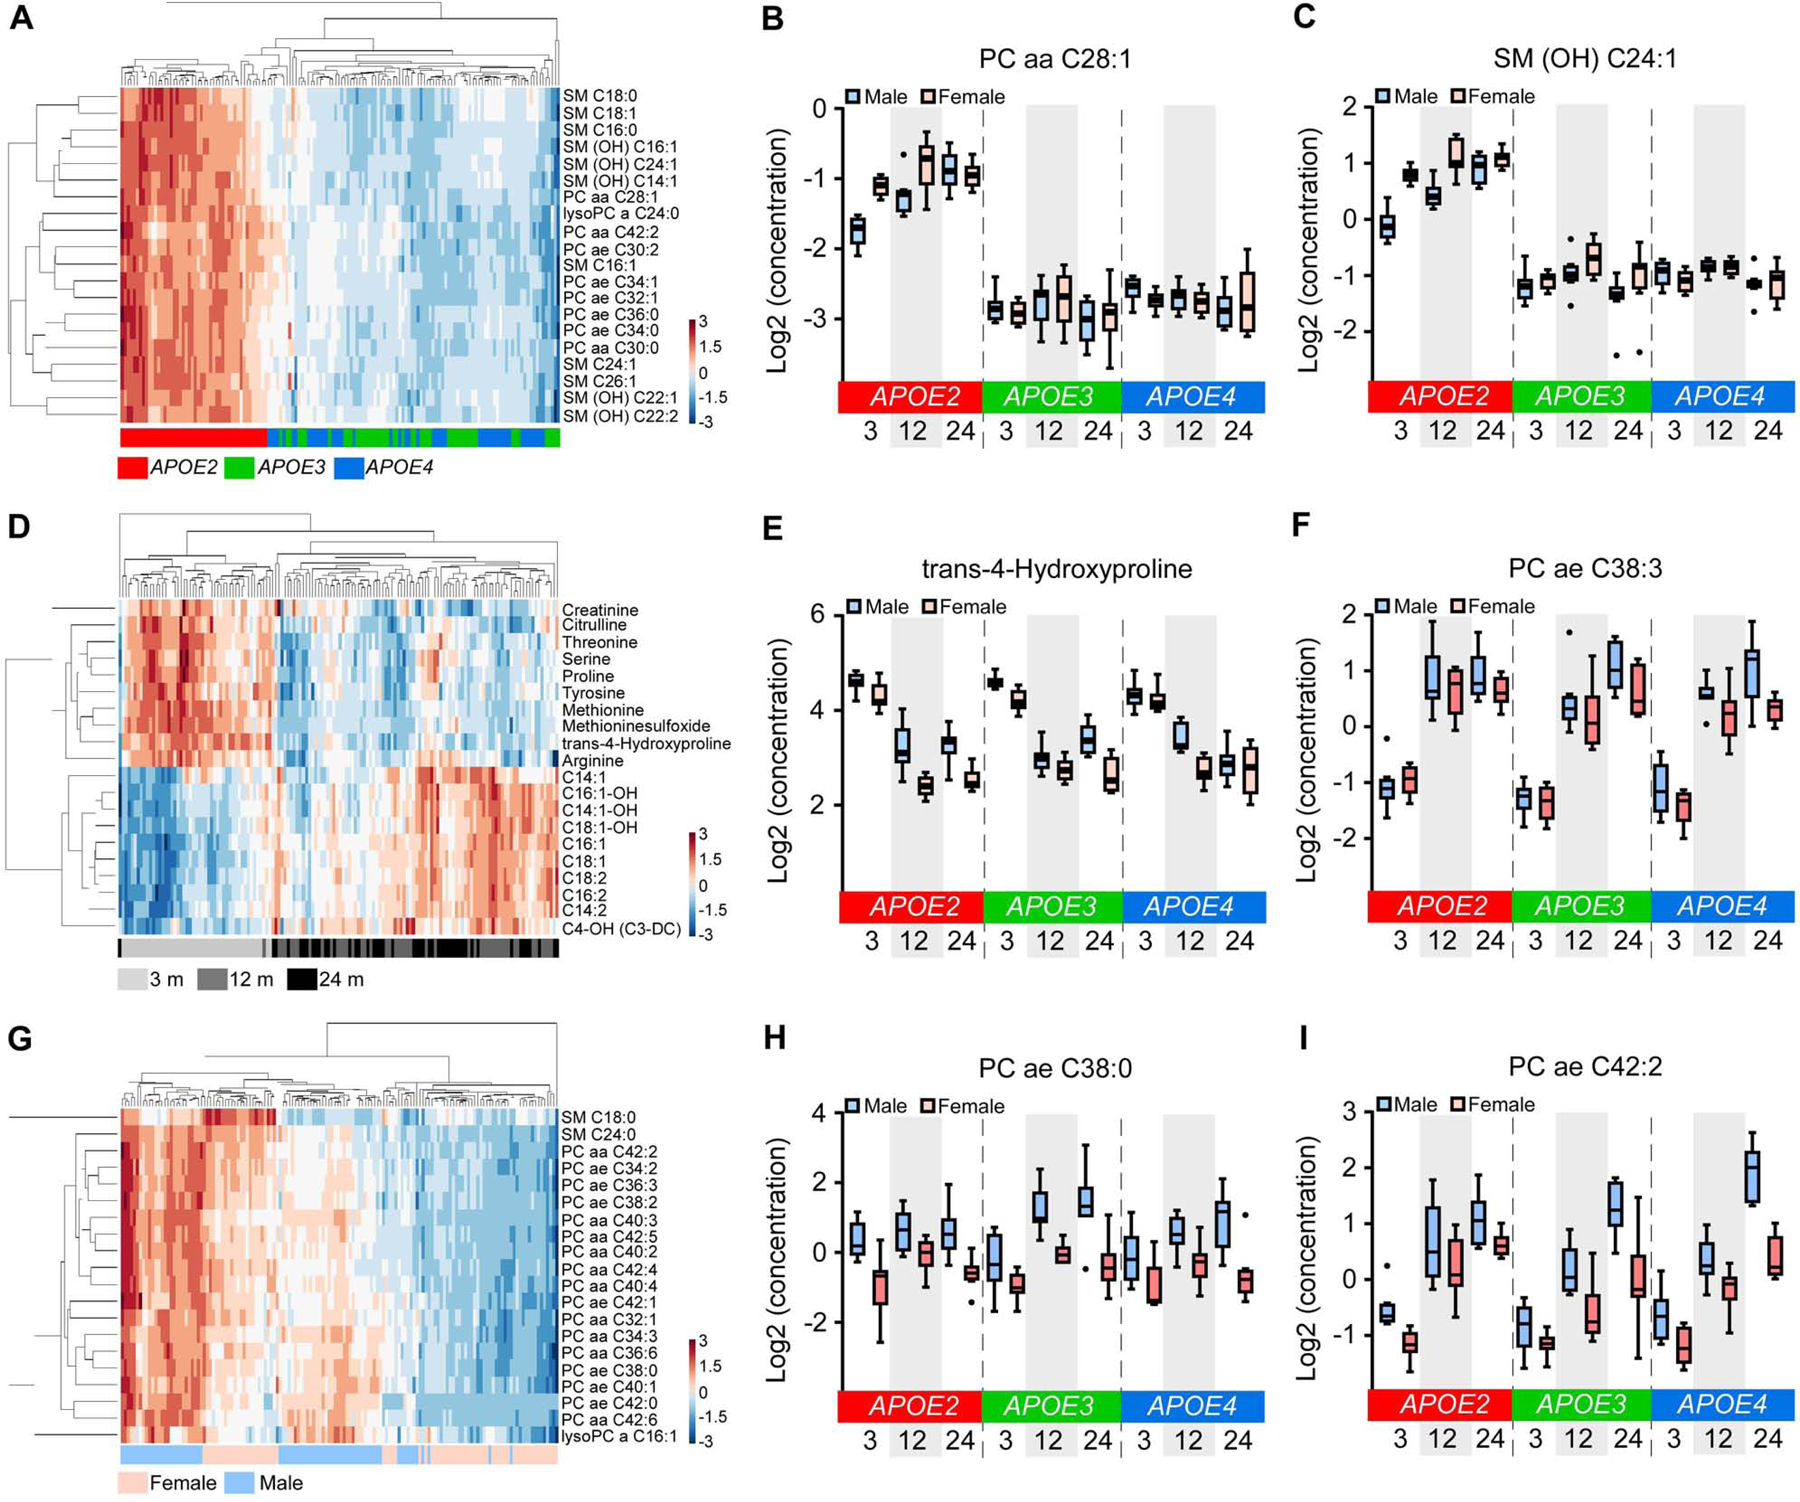
(A, D and G) Hierarchical clustering of the top 20 DEMs affected by APOE genotypes (A), age (D), or sex (G) (Bonferroni-corrected p < 0.05). (B, C, E, F, H and I) The expression levels of the top 2 DEMs in the comparison among APOE genotypes (B and C), ages (E and F), or sexes (H and I). The upper and lower lines in the boxplots represent the maximum and minimum values after Tukey’s test. The center line represents the median. N = 7–8 mice/genotype/age/sex.