
Figure 3. Prolonged mitosis in vivo results in apoptosis in daughter cells.
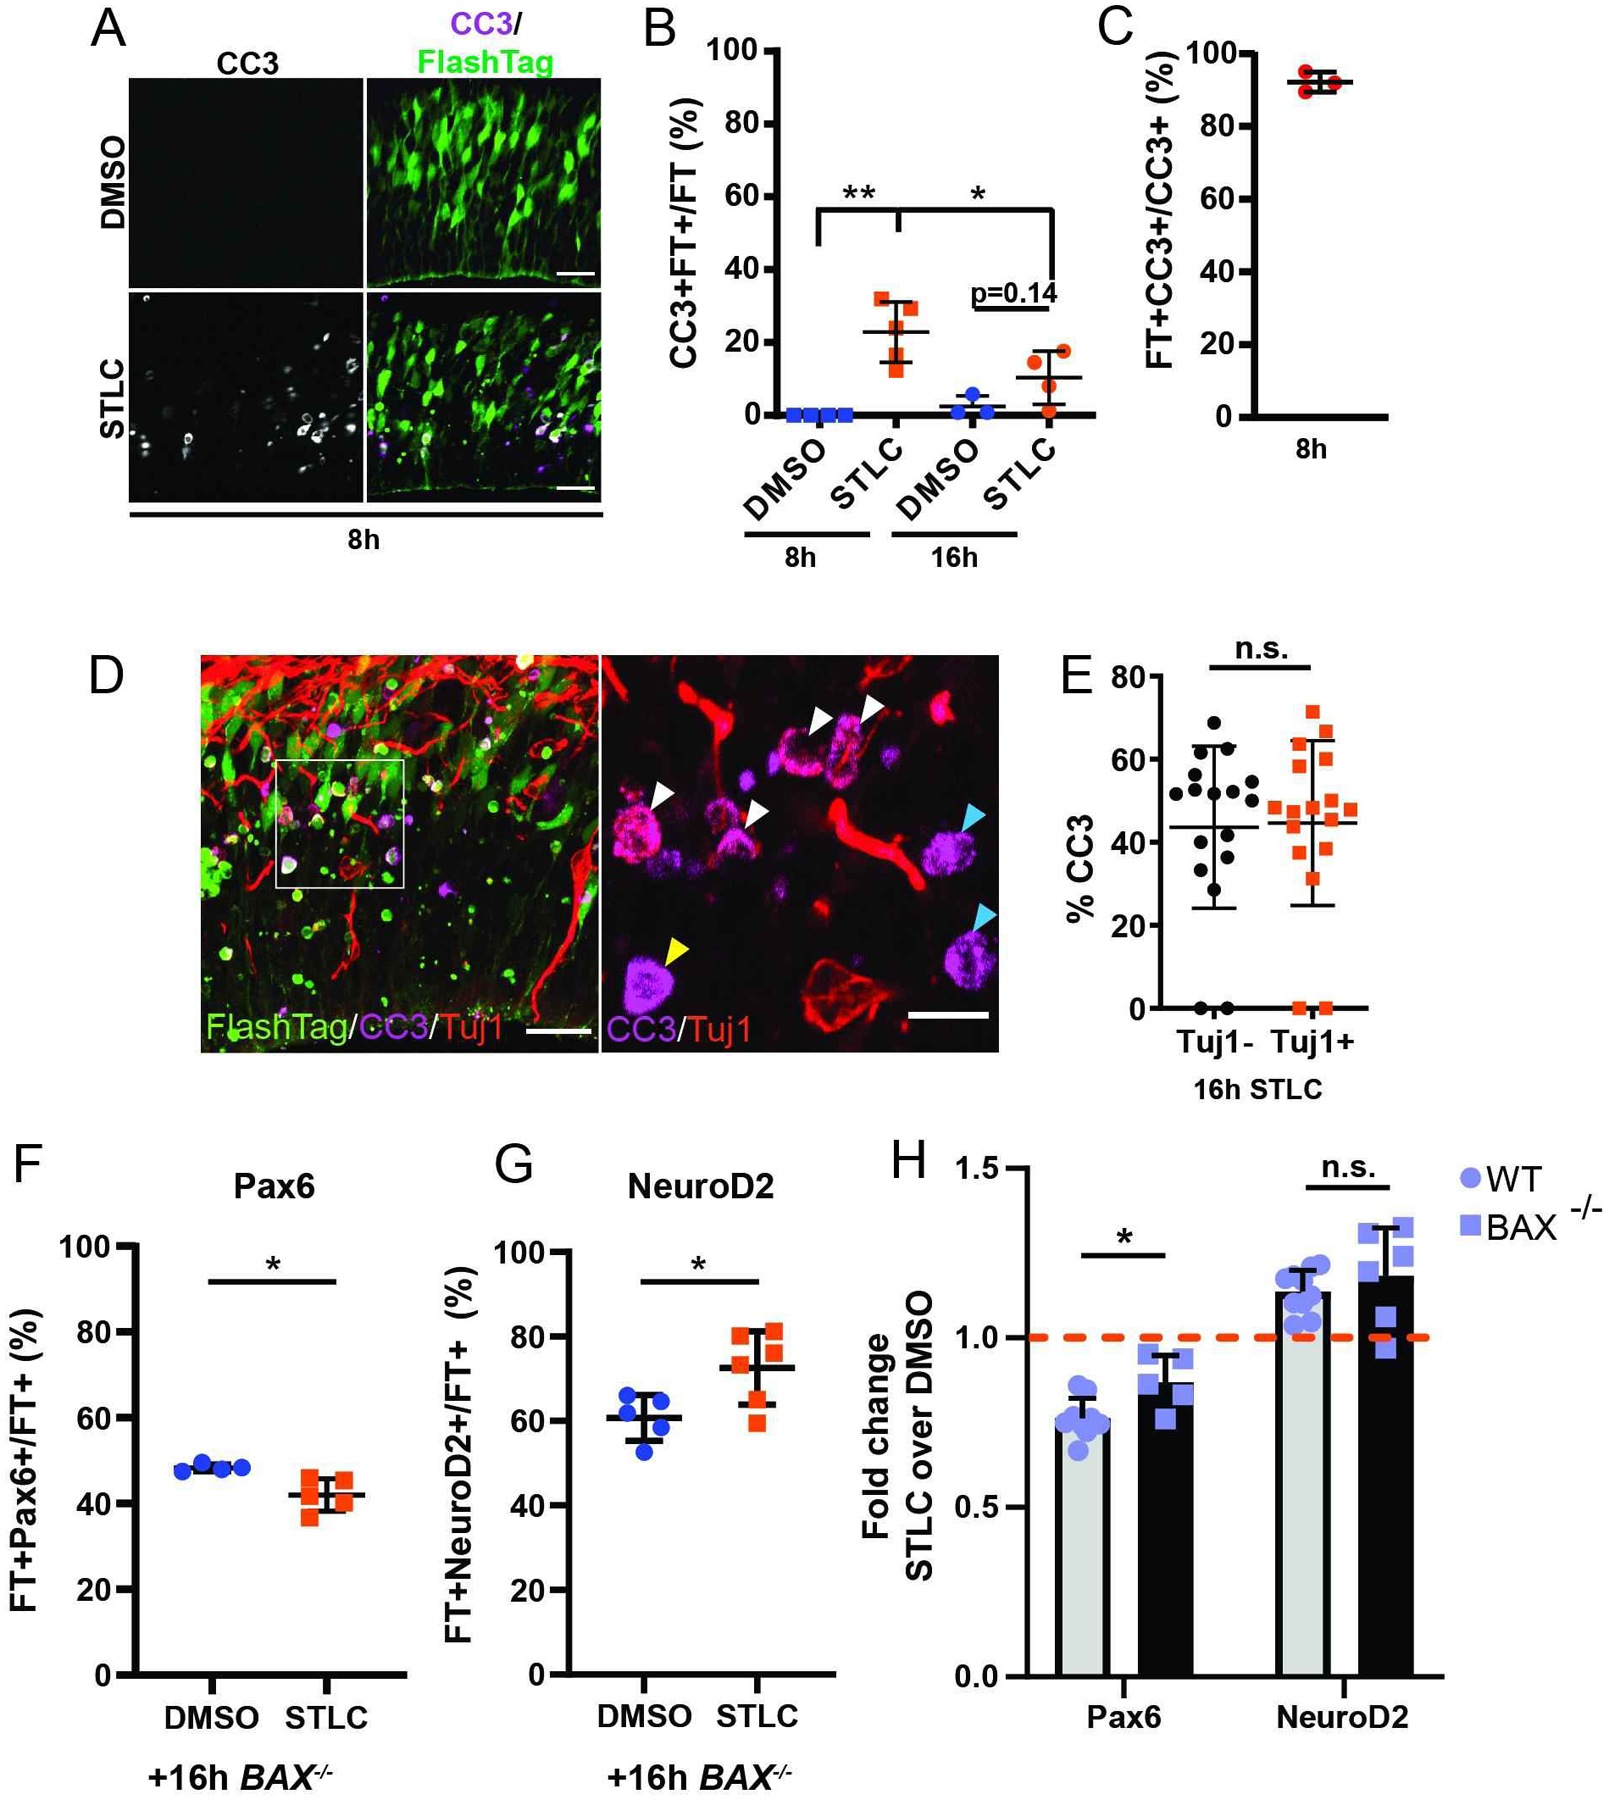
A) Images depicting the VZ/SVZ with FT (green) and CC3 (white) 8h after injection of DMSO or STLC. B) Quantification of the fraction of FT cells which are CC3+FT+ cells in 200 μm wide radial columns. C) Quantification of CC3+ cells that are FT+ at 8h in STLC condition. Dots represent individual embryos, n= 2 or more sections each. D) Images depicting the VZ/SVZ +16h after injection of STLC, depicting FT (green), CC3 (purple), and Tuj1 (red). Inset, right: ROI depicting CC3 and Tuj1. White arrowheads: FT+CC3+Tuj1+; Yellow arrowheads: FT+CC3+Tuj1−; Blue arrowheads: FT+CC3+Tuj1−. E) Quantification of the fraction of CC3+ cells that are either Tuj1+ or Tuj1− 16h after STLC injection, in 200 μm wide radial columns. N>10 sections. F and G) Quantification of the fraction of FT+ cells which are Pax6 (F) or NeuroD2 (G) 16h after injection of DMSO or STLC in E14.5 Bax−/− embryos; in 200 μm wide radial columns. Pax6 analysis, DMSO: n=4 embryos; STLC: n=5 embryos, n=3 sections each. NeuroD2 analysis, DMSO: n=5 embryos, STLC: n=6 embryos, n= 3 sections each. H) Comparison of fold changes in expression of Pax6 or NeuroD2 between WT and Bax−/− embryos at 16h following STLC injection. CC3 8h ***: p=0.001, 8h v 16h: p=0.05. BAX Pax6 *: p=0.015, NeuroD2 *: p=0.03. Pax6 BAX v WT *: p=0.01. Students t-test. Scale bars: A, D, 25 μm; D, 10 μm, Error bar=s.d.