
Figure 4. Transcriptome analysis following prolonged mitosis.
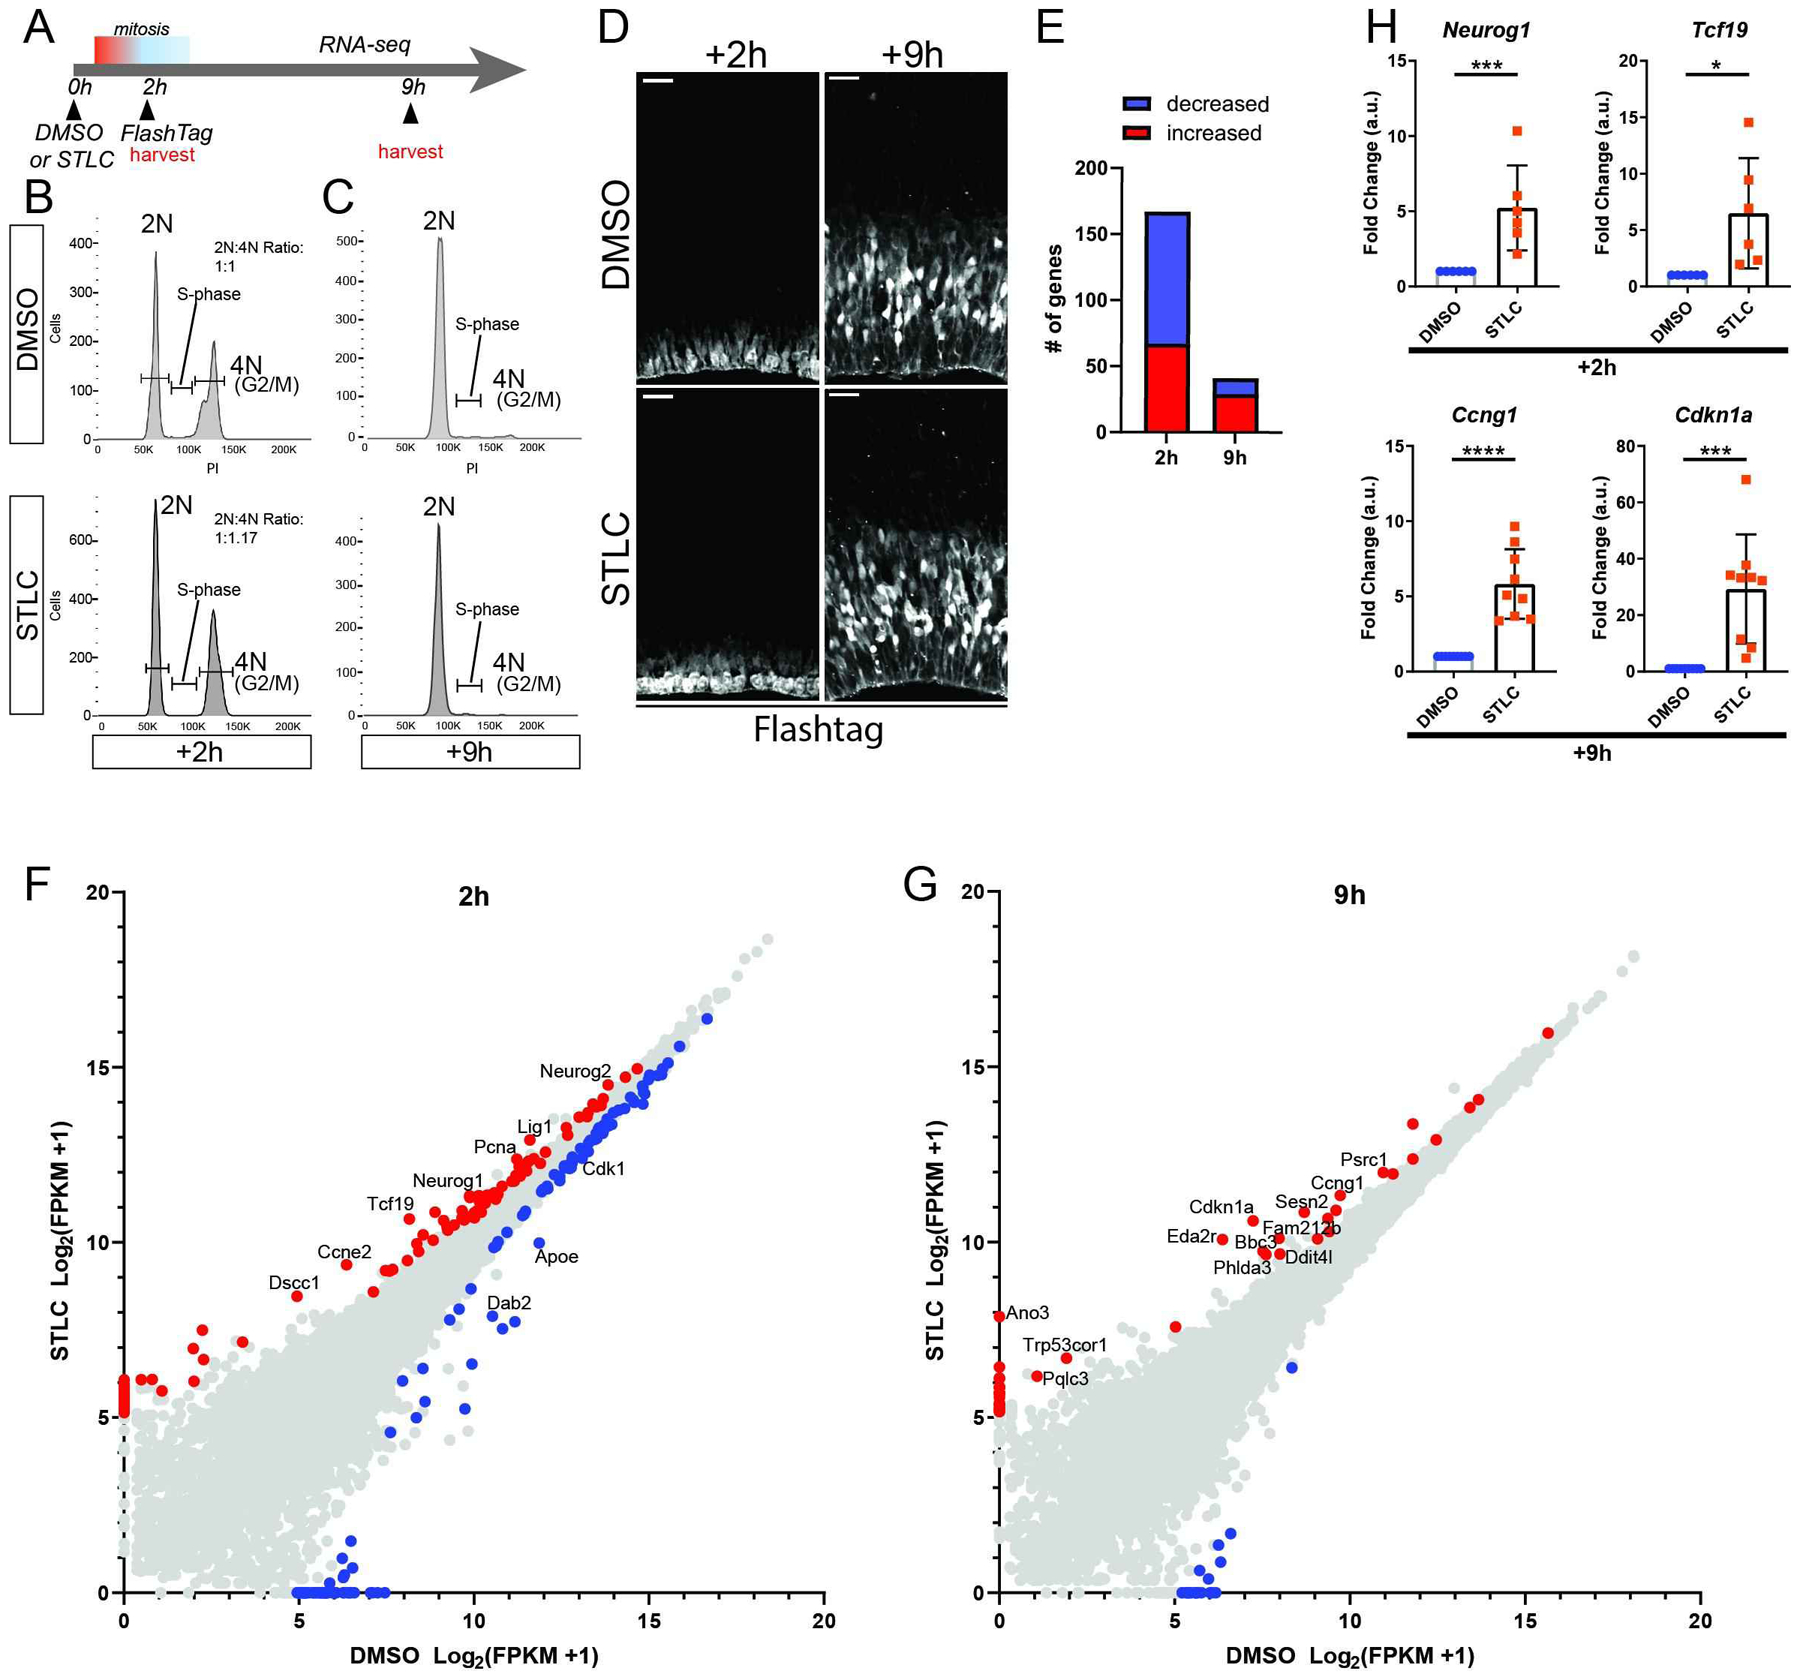
A) Schematic of RNA-seq analysis. B) Images depicting cortices stained for FT (white) 2 and 9 hrs after injection with either DMSO and STLC conditions, corresponding to RNA-seq timepoints. C, D) Cell cycle plots of FACS sorted populations by condition and timepoint. Y axis: cell count, X axis: Propidium Iodide. E) Graph of total significant transcript changes at both timepoints, >2-fold expression difference STLC v DMSO, p<0.05. F, G) Scatterplots of gene expression changes at +2h (F) and +9h (G) timepoints. Red: p<0.05, enriched in STLC. Blue: p<0.05, enriched in DMSO. Transcripts of notable change or associated with significant pathways have been annotated. H) qPCR for select RNA-seq candidates at +2h and +9h timepoints. Neurog1 ***: p=0.004, Tcf19 ***: p=0.02, Ccng1 ***: p<0.0001, Cdkn1a ***: p=0.0005. Dots equal independent biological replicates. At +2h, samples were identical to those use for FACs, whereas at +9h, 3 brains were from FACS and remaining were independent replicates. Error bar=s.d.