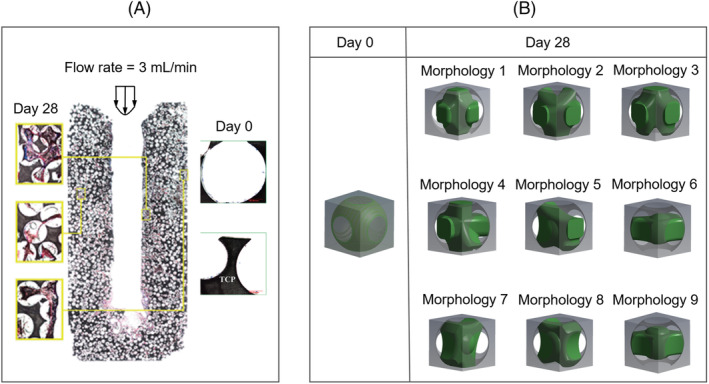
FIGURE 2.

A, Histological images that show the observed morphologies of cell/ECM within the scaffold at day 0 and day 28 (adapted from Reference 18), B, idealised morphologies of cell/ECM at day 0 and day 28 for the computational model. ECM, extracellular matrix
