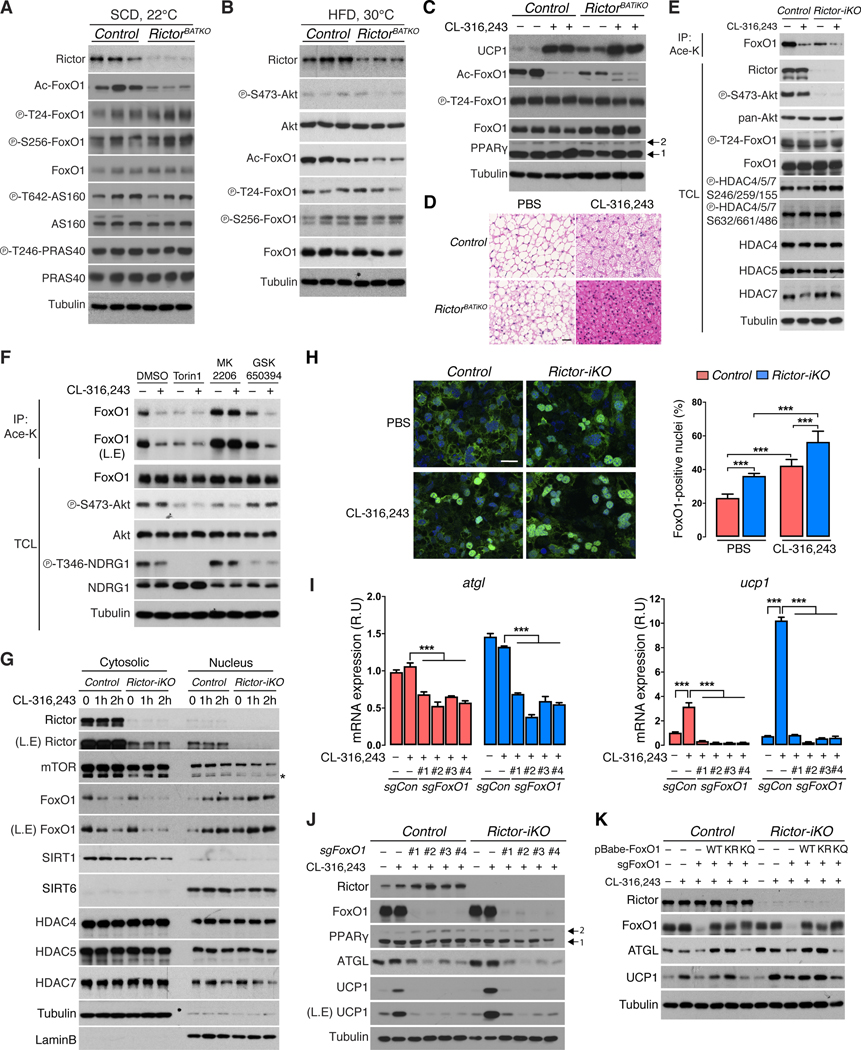
Figure 5. mTORC2 loss and β-adrenergic receptor signaling promote FoxO1 deacetylation and nuclear localization.
(A) Western blot analysis using BAT lysates from fasted/refed RictorBATKO and control mice living at 22°C and eating SCD (14w males, n=3).
(B) Western blot analysis using BAT lysates of fasted/refed RictorBATKO and control mice living at 30°C and eating HFD for 8 weeks (18w males, n=3).
(C) Western blot analysis using BAT from RictorBATKO and control mice living at 30°C treated with PBS or CL-316,243 (0.5mg/kg, n=2) for three days. Arrows indicate PPARγ isoforms.
(D) Representative H&E staining images from (C). Scale bar, 100 μm.
(E) Immunoprecipitation assay using an anti-acetyl-lysine antibody (Ace-K) and blotting for total FoxO1 from CL-316,243-stimulated (1μM, 2h) control and Rictor-iKO brown adipocytes. Total cell lysate (TCL) was also probed with the indicated antibodies.
(F) Immunoprecipitation assay as in (E). Cells were pretreated for 1 hour with Torin1 (50nM), MK2206 (0.5μM), or GSK650394 (1μM, O/N) followed by CL-316,243 treatment (1μM, 2h).
(G) Western blot analysis of the cytoplasmic and nuclear fractions of Rictor-iKO brown adipocytes and controls treated with CL-316,243 (1μM) for 1 or 2 hours. Tubulin and Lamin B are used to control for fraction purity.
(H) Immunofluorescence analysis of control and Rictor-iKO brown adipocytes treated with vehicle (PBS) or CL-316,243 (1μM, 1h, n=6). Anti-FoxO1 antibody (green), DAPI (blue), and the corresponding quantification (right panel) is shown. Scale bar, 25 μm
(I) qRT-PCR analysis from Rictor-iKO brown adipocytes and controls, with or without CL-316,243 stimulation and deleted for FoxO1 by CRISPR/Cas9 using 4-independent sgRNAs (n=3).
(J) Corresponding Western blot analysis from (I). Arrows indicate the PPARγ isoforms.
(K) Western blot of lysates from control or Rictor-iKO brown adipocytes in which endogenous FoxO1 was deleted (sgFoxo1) and cells were reconstituted with FoxO1-WT, FoxO1–6KR, or FoxO1–6KQ mutant constructs. Data are mean ± SEM. Statistical significance was calculated using two-way ANOVA with the Tukey’s multiple comparisons test; *P < 0.05, **P < 0.01, ***P < 0.001 (PBS vs. CL-316,243-treated, Control vs. Rictor-iKO, sgControl vs. sgFoxO1). L.E.=long exposure

