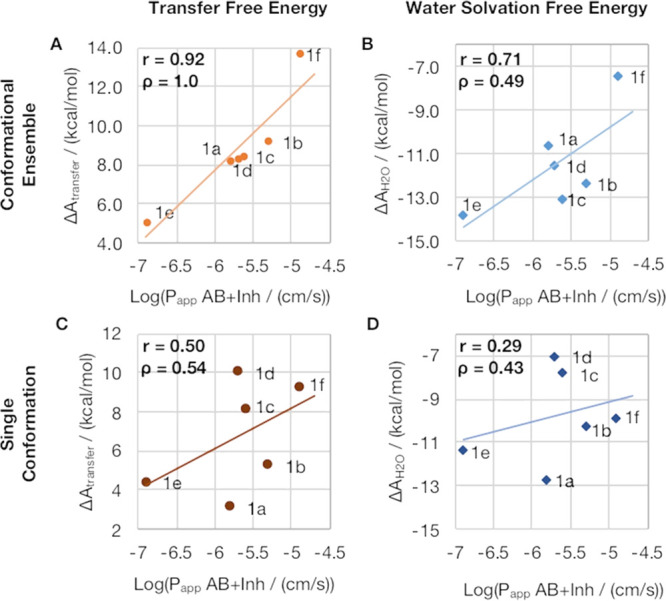
Figure 5.

Impact of conformational sampling and contributions from both solvents on prediction accuracy. The top row depicts the cell permeabilities compared to (A) transfer free energies and (B) water solvation free energies considering the conformational ensemble of each macrocycle. The bottom row shows the results of the same calculations when only a single conformation is included (C - transfer free energy, D - water solvation free energy).
