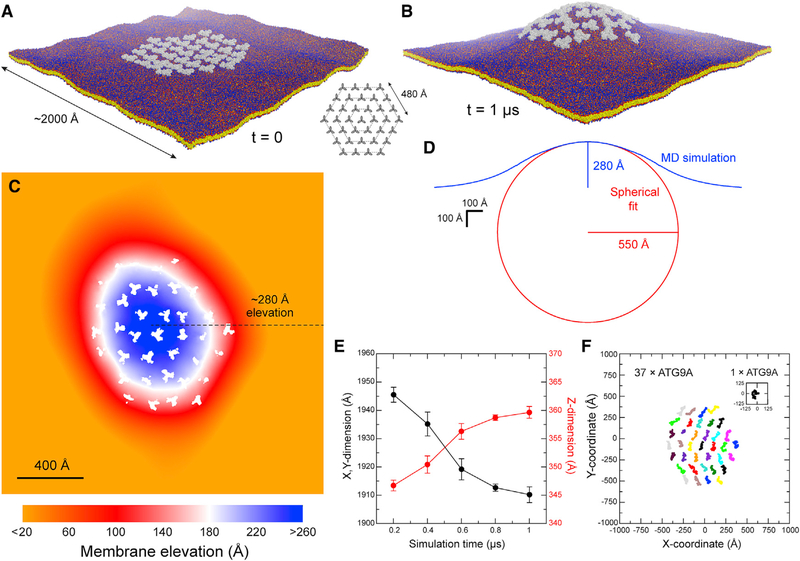
Figure 7. Molecular Dynamics Simulation of a Hypothetical ATG9A Cluster in a POPC Bilayer.
(A) Configuration of the system at the beginning of the simulation; 36 ATG9A proteins (gray) are arranged around a central trimer in three concentric hexagons (inset). Note the proteins are not in contact. The system amounts to ~11,220,000 particles. Solvent is again omitted for clarity.
(B) Same as (A), at the end of the calculated trajectory of 1 μs. See also Video S2.
(C) Quantification of the membrane perturbation induced by the ATG9A cluster. Note change in scale relative to Figure 6B. White spaces across the map correspond to the area occupied by ATG9A copies.
(D) Cross-section of the dome-like structure shown in (B) (blue curve). The data reflect an average of 36 cross-sections that meet at the apex of the dome and differ by rotations around the z axis in 10° increments. The approximate elevation of the apex is indicated. The cross-section of the dome is compared with a sphere whose curvature fits the simulation data (red curve).
(E) Time-evolution of the x,y, and z dimensions of the simulation system during the calculated trajectory. As the dome emerges, the z dimension increases and the x,y dimension decreases accordingly. The system ceases to change significantly after 0.8 μs. The plot shows time-averages for consecutive 200-ns trajectory fragments and the corresponding SD values.
(F) Free lateral diffusion of the 37 copies of ATG9A during the calculated trajectory of 1 μs. Each trace (colors) represents the center-of-mass of one ATG9A protein. For comparison, a trace is also shown for isolated ATG9A, in the same scale, from the simulation system shown in Figure 6A.

