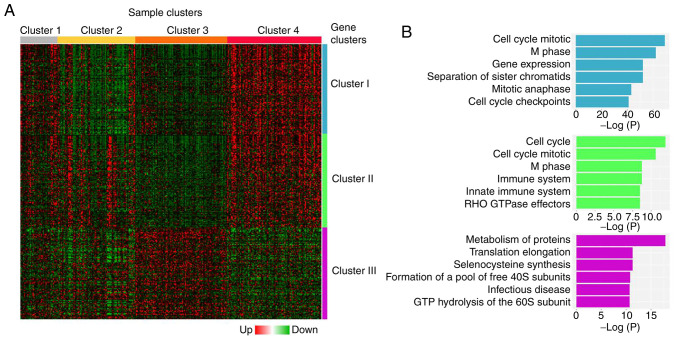
Figure 2.
Hierarchical clustering of grade 1 and 3 EC samples. (A) Differential gene expression analysis between grade 1 and 3 EC tumors generated four sample clusters (clusters 1–4) and three gene clusters (clusters I–III). Heatmap representation of the top 100 significant genes of each gene cluster is shown. (B) Functional enrichment analysis of gene clusters showing most significantly represented biological processes for each gene cluster. EC, endometrial cancer.

