Figure 1.
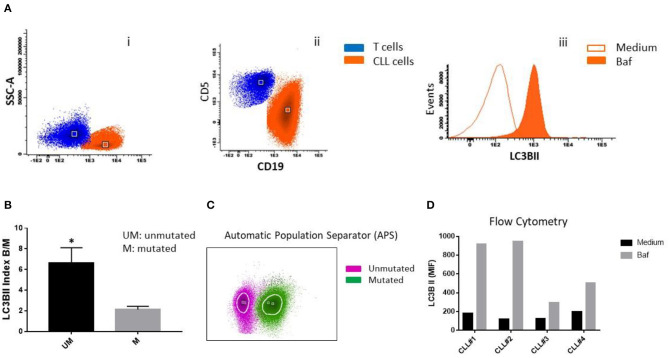
LC3B expression in CLL cells. (A) PBMC cells from patients with CLL were treated with 25 nM bafilomycin (Baf) or medium (untreated control) for 24 h. Flow cytometric analysis of LC3B expression in CLL cells is shown. (i) Dot plot of CD19 vs. side scatter (SSC) of B lymphocytes from CLL patients. (ii) Dot plot of CD19 vs. CD5 shows clonal CLL cells and residual T cells. (iii) Histogram showing LC3B expression (MFI) in clonal B cells treated with Baf and untreated cells. (B) LC3B index B/M was calculated by dividing MFI of LC3B of CD19+CD5+ (clonal B cells) treated with bafilomycin by MFI of LC3B of untreated clonal B cells (*p < 0.05, unpaired t-test). (C) Automatic population separator (APS) shows two populations: LC3B+ CLL cells from two patients with unmutated IGHV (Purple) and LC3B+ CLL cells from two patients with mutated IGHV (Green). (D) PBMC cells from all four patients (CLL#1, Patient #1; CLL#2, Patient #2; CLL#3, Patient #3; CLL#4, Patient #4) were treated with bafilomycin 25 nM for 2 h. After that, MFI of LC3B was determined by flow cytometry, as described in (A).

