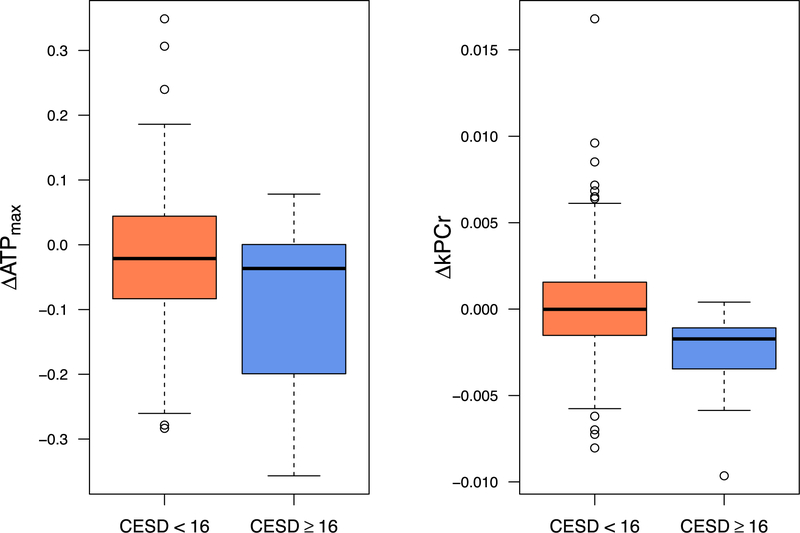
FIGURE 1.
Box plots examining change in skeletal muscle mitochondrial function and incident depression at follow-up. Box plots graphically depict mean change in skeletal muscle mitochondrial function as a function of depression status at follow-up (CES-D ≥16 versus CES-D <16). These box plots offer complementary information to the results from the logistic regression models.

