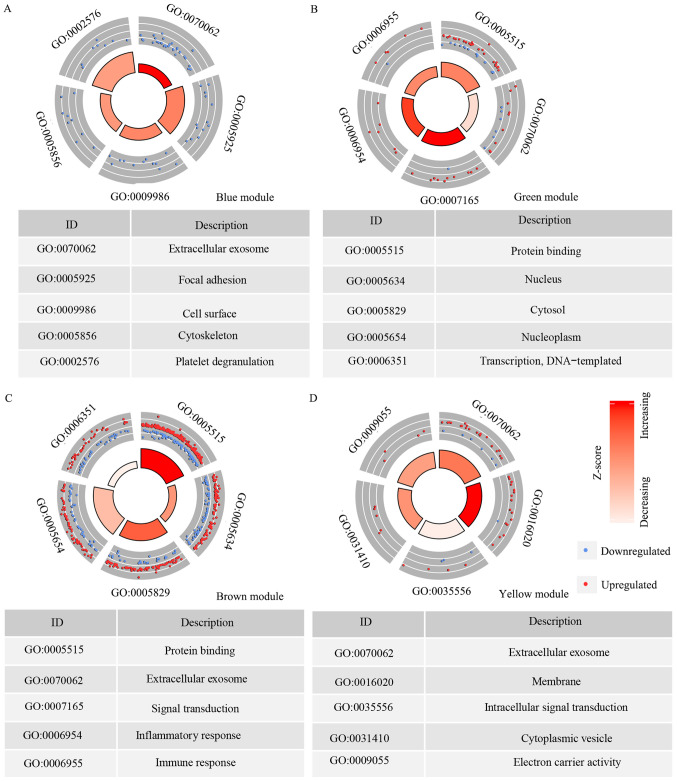
Figure 4.
Circle plot presenting the top five GO term that each of the module genes are enriched in. (A) Blue module. (B) Green module. (C) Brown module. (D) Yellow module. Z-score represents the overall change in the expression of genes that are enriched in the GO term. Red represents increasing gene expression, while white represents decreasing gene expression. GO, Gene Ontology.

