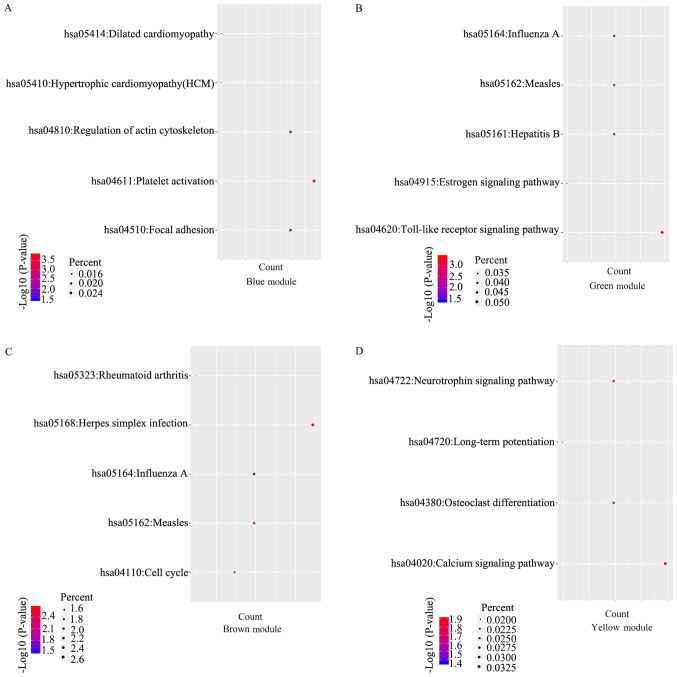
Figure 5.
KEGG analysis for genes in the four modules. (A) Blue module. (B) Green module. (C) Brown module. (D) Yellow module. The top five KEGG pathways are presented in the bubble chart. The size of bubble represents the enrichment score, while colors indicate enrichment significance (P-value). KEGG, Kyoto Encyclopedia of Genes and Genomes.

