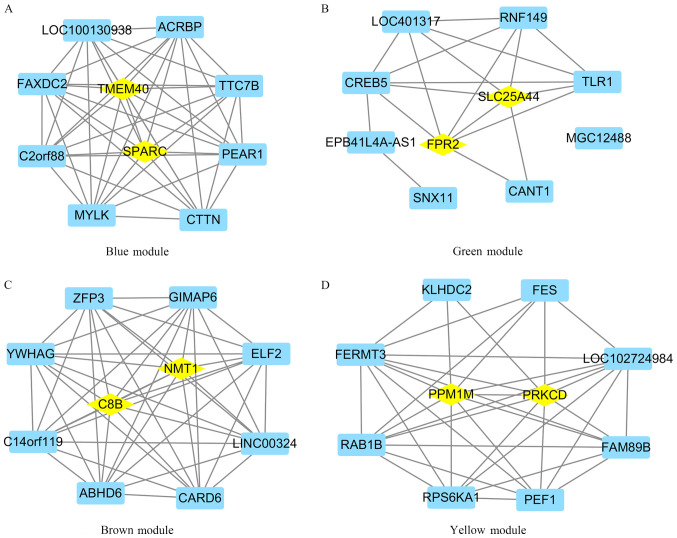
Figure 6.
Identification of hub genes in the four modules. Top 10 genes in each module with the highest module membership were used to construct the co-expressed network. The co-expressed network was visualized using Cytoscape. Genes with higher module memberships in module and degree score in the co-expressed network were identified as hub genes. (A) Blue module. (B) Green module. (C) Brown module. (D) Yellow module. Rhombus in the protein-protein interaction network represents the hub gene.

