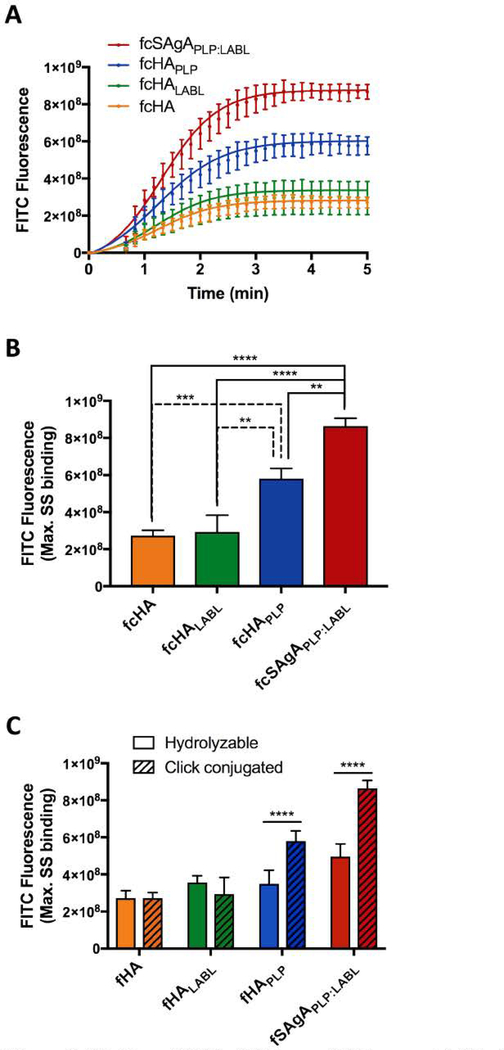
Figure 3.
Binding of fcHA, fcHALABL, fcHAPLP, and fcSAgAPLP:LABL with Raji B cells determined by flow cytometry: (A) Binding kinetics showing association through steady state. (B) Relative binding at maximum steady state (max. SS). (C) Comparison of max. SS binding with hydrolyzable versus click-conjugated arrays. Statistical significance determined by ANOVA followed by Tukey’s (B) or Sidak’s (C) post hoc test with p<0.05 and n=3 (*p<0.05, **p<0.01, ***p<0.001, ****p<0.0001). Robust curve fitting in (A) was performed using sigmoidal nonlinear regression.

