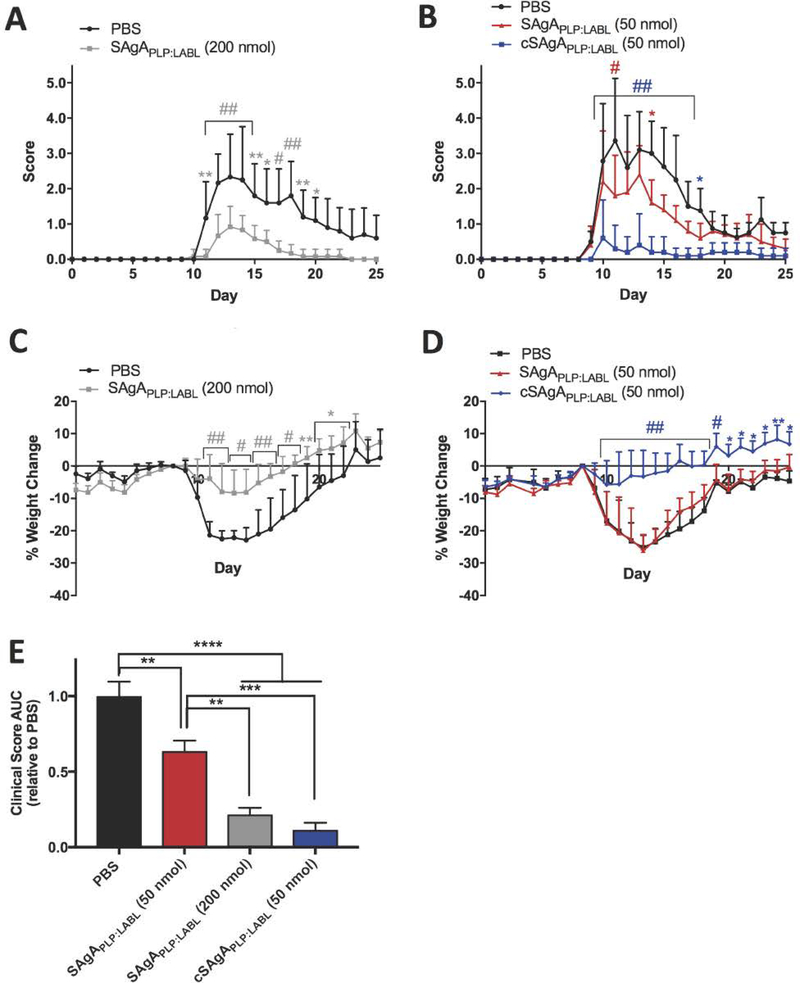
Figure 9.
Comparing SAgAPLP:LABL and cSAgAPLP:LABL therapeutic efficacy in EAE: (A) SAgAPLP:LABL (200 nmol PLP dose) clinical scores (n=6), (B) cSAgAPLP:LABL versus SAgAPLP:LABL (50 nmol PLP dose) clinical scores (n=5), (C) SAgAPLP:LABL (200 nmol PLP dose) weight change, (D) cSAgAPLP:LABL versus SAgAPLP:LABL (50 nmol PLP dose) weight change, and (E) clinical score area under the curve (AUC) relative to PBS. Statistical significance was determined by ANOVA followed by Dunnet’s (A-D) or Tukey’s (E) post hoc test with p<0.05 (*p<0.05, **p<0.01, #/***p<0.001, ##/****p<0.0001).

