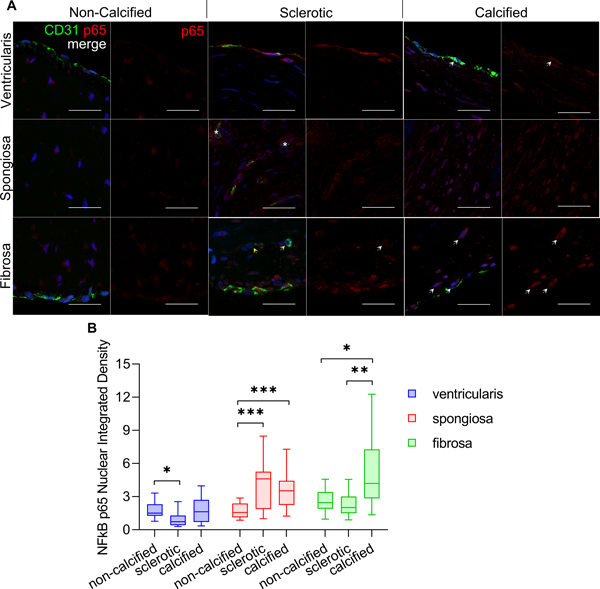
Figure 1.

A. Representative images of CD31 (green) and NFkB p65 (red) co-staining of non-calcified, sclerotic, and calcified/stenosed human aortic valves (horizontal axis). Panels indicate expression at ventricularis, spongiosa, and fibrosa regions (vertical axis). White arrows indicate nuclear p65 expression. Asterisks indicate neo-vessel formation in intimal region. Yellow arrows indicate CD31 positive cells in the sub-endothelial region, independent of neo-vessel formation. Scale bar is 100 um. B. Nuclear p65 integrated density, normalized to the sclerotic valve ventricularis expression. Statistical significance indicated comparing different patient groupings for the same valvular-region (e.g. ventricularis of non-calcified vs. sclerotic vs. calcified valves), *: p < 0.05; **: p < 0.005, ***: p < 0.0005).
