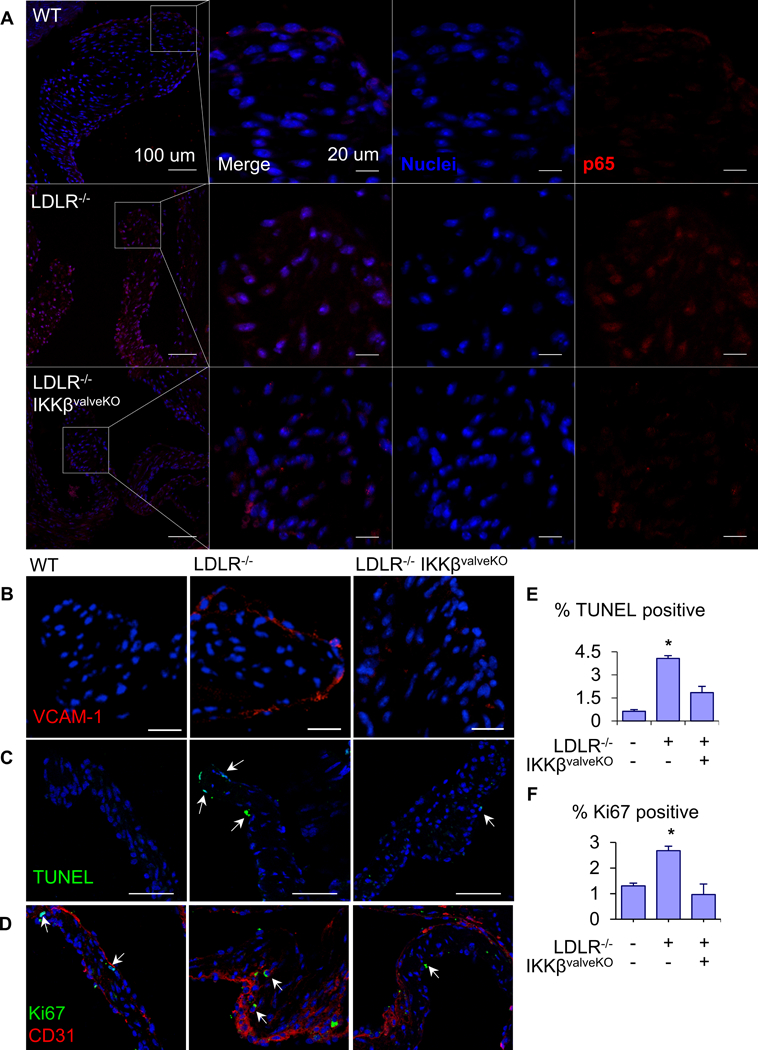
Figure 2.

A. Representative images of NFkB p65/RelA (red) protein expression and nuclear localization (arrows) in aortic valve leaflets of 5 month-old WT, AVD, and AVD+IKKβf/f mice. Scale bars are 100μm (left-most column) and 20μm (second column on). B. Representative images of VCAM-1 (red) protein expression from same groups. Scale bar is 100μm. C. TUNEL assay for apoptosis in AoV of same groups, quantification of the percent of cells in the AoV positive for TUNEL staining (n = 5). Scale bar is 100 μm. D. Analysis of proliferation in AoV of same groups via Ki67 staining. Ki 67 (green) and CD31 (red), scale bar is 100μm. Quantification of percent of cells in the AoV positive for nuclear Ki67 (n = 5). Asterisks indicate statistically significant groups (*: p < 0.05).
