Figure 6.

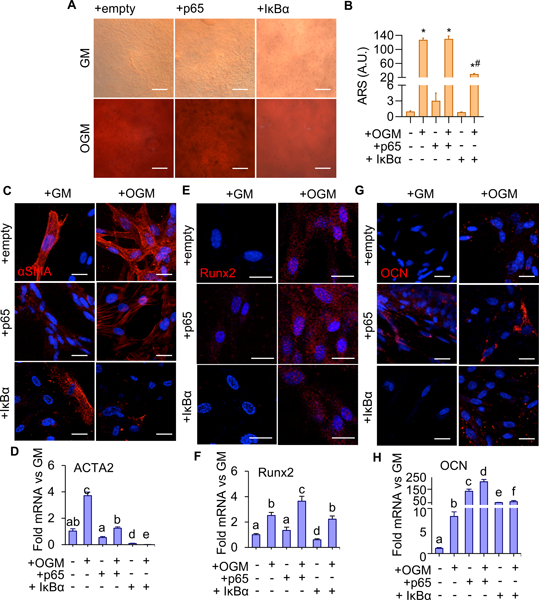
A. Alizarin Red S staining for calcium in 14 day VIC with p65 over-expression (+p65) or inhibition (+IκBα) treated with GM or OGM. Scale bar is 100μm. B. Quantification of calcium deposition using ARS dye-extraction assay, normalized to GM + empty vector control (n = 6). (*: significant from groups 1, 3, 5; #: significant from 2; $: significant from 4, p < 0.05). C. αSMA protein expression in VIC with p65 over-expression (+p65) or inhibition (+IκBα) vectors, with 14-day GM or OGM treatment. Scale bar is 20μm. D. ACTA2 mRNA in VIC, same conditions as in C (n = 4). E. Runx2 protein expression in VEC, same conditions as C. Scale bar is 20μm. F. Runx2 mRNA in VIC, same conditions as E (n = 4). G. Osteocalcin (OCN) protein expression in VIC, same conditions as E. H. OCN mRNA in VIC, same conditions as G (n = 4). Statistical significance between different groups are indicated by unshared letter assignments. Different letters indicate statistically significant differences between groups (p < 0.05). Error bars indicate SEM.
