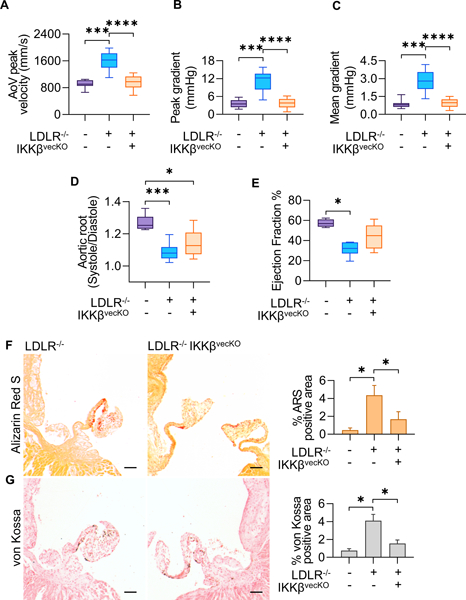
Figure 8.

Echocardiographic measurements of AoV function of 5 month old mice, 4 months of high fat diet in all models except WT control. (WT: n=11, LDLR−/−: n=17, LDLR−/−IKKBvecKO: n=15) A,B,C. Mean AoV peak jet velocity (mm/s), Peak gradient (mmHg), and Mean gradient (mmHg) from Pulsed-wave Doppler imaging, calculated using the average peak from > three cardiac cycles for each mouse. D. Ratio of Aortic Root Systolic:Diastolic ratio calculated from M-mode echocardiographic measurements of aortic root diameter during peak diastole and systole. E. Cardiac Ejection Fraction percentage calculated from parasternal long-axis ventricular volume at peak systole and diastole. Asterisks indicate statistically significance (*: p < 0.05, **: p < 0.005, ***: p < 0.0005, ****: p < 0.00005). F. Alizarin Red S staining for calcium in AoV. Scale bar is 100μm. G. von Kossa staining for mineral deposition in AoV. Scale bar is 100μm. Quantification indicates percent of the total valve area that was positive for indicated stain, measured from valve hinge-point between annulus and cusp, to the distal tip (n = 5). Asterisks indicate statistically significance (*: p < 0.05, **: p < 0.005, ***: p < 0.0005, ****: p < 0.00005).
