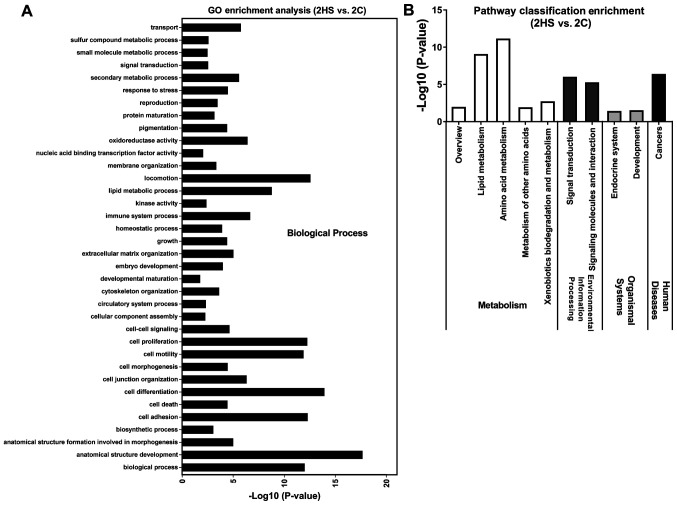
Figure 7.
GO and KEGG pathways enrichment of differentially expressed genes between 2HS and 2C. (A) GO term enrichment analysis (P<0.05). (B) KEGG pathway classification enrichment analysis (P<0.05). GO, Gene Ontology; KEGG, Kyoto Encyclopedia of Genes and Genomes; HS, hypertrophic scarring; C, control.

