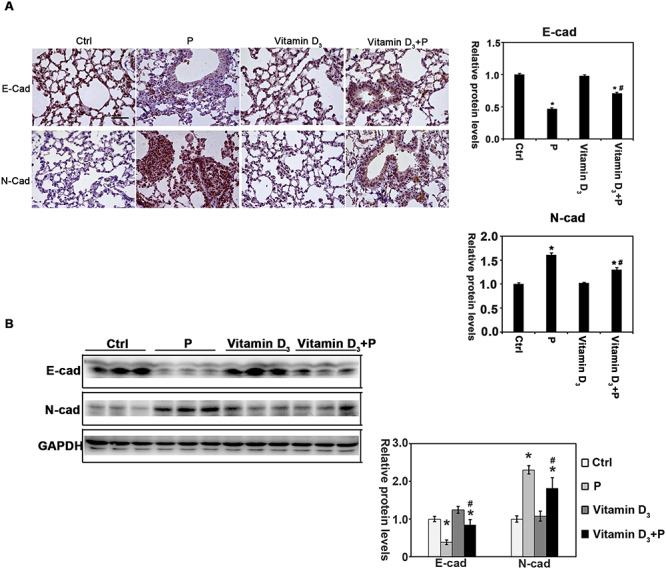
Figure 3.

Vitamin D3 regulates the levels of E-cadherin and N-cadherin in the particle-exposure lung tissue. (A) IHC staining of E-cadherin, and N-cadherin was performed [n = 10, and a representative image of the lung tissue from each group is shown (scale bar: 100 μm)]. The quantification of the above IHC images is shown. Results are expressed as mean ± SD (*P < 0.05, Ctrl vs. treatment groups; #P < 0.05, P vs. Vitamin D3 + P). (B) Lung tissue lysates from each group were subjected to immunoblot analysis with E-cadherin and N-cadherin antibodies. The intensity of the indicated antibody’s bands from three independent experiments was quantified.
