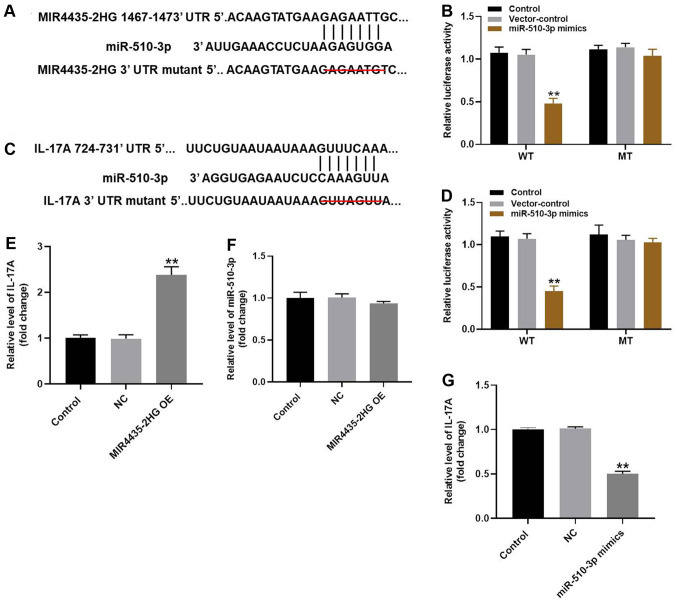
Figure 5.
MIR4435-2HG OE significantly suppressed the progression of OA via the miR-510-3p/IL-17A axis. (A) Gene structure of MIR4435-2HG at the position of 1467-1473 indicated the predicted target site of miR-510-3p in its 3'UTR, with a sequence of GACAATC. (B) Luciferase activity was measured in CHON-001 cells following co-transfection with WT/MT MIR4435-2HG 3'-UTR plasmid and miR-510-3p with the dual luciferase reporter assay. (C) Gene structure of IL-17A at the position of 724-731 indicated the predicted target site of miR-510-3p in its 3'UTR, with a sequence of GUUAGUU. (D) Luciferase activity was measured in CHON-001 cells following co-transfection with WT/MT IL-17A 3'-UTR plasmid and miR-510-3p with the dual luciferase reporter assay. (E) Gene expression of IL-17A in CHON-001 cells was detected by RT-qPCR. (F) Gene expression of miR-510-3p in CHON-001 cells was detected by RT-qPCR. (G) Gene expression of IL-17A in CHON-001 cells was detected by RT-qPCR. **P<0.01 vs. control. OE, overexpression; IL, interleukin; miR, microRNA; RT-qPCR, reverse transcription-quantitative PCR; WT, wildtype; MT, mutant; UTR, untranslated region; NC (empty vector), negative control.

