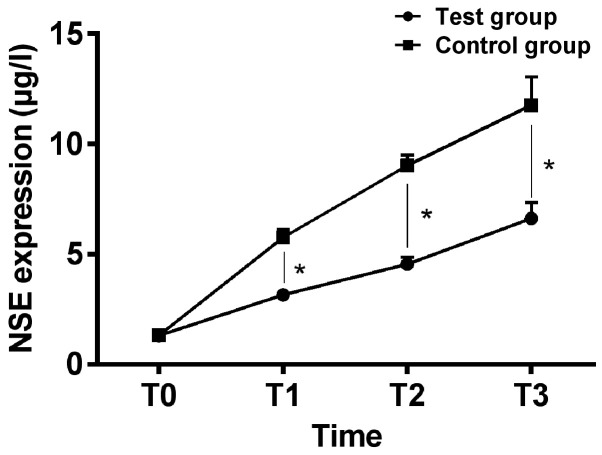
Figure 1.
Comparison of expression of serum NSE of patients between the two groups at different time-points. ELISA analysis showed that there was no significant difference in expression of serum NSE between the two groups at T0 (P>0.05), expression of serum NSE increased gradually during operation of patients in both groups, and expression of serum NSE of patients in the intervention group at T1 to T3 was significantly lower than those of patients in the control group, and the difference was statistically significant (P<0.05). *P<0.05. NSE, neuron-specific enolase; ELISA, enzyme-linked immunosorbent assay.

