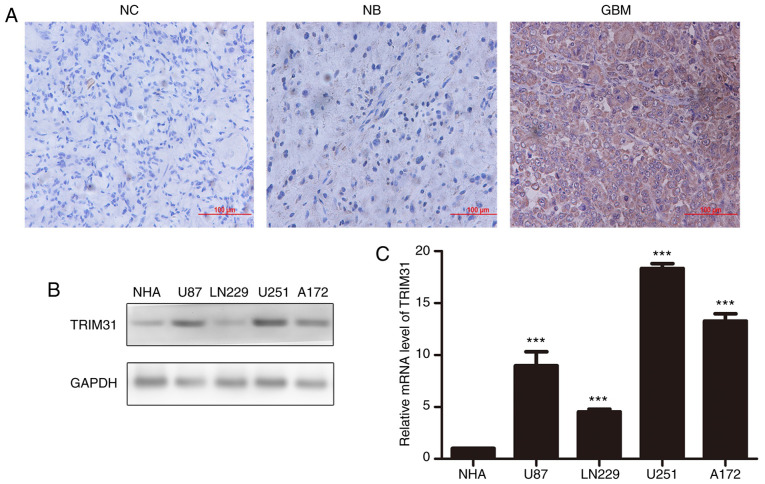
Figure 1.
Expression levels of TRIM31 in glioma tissues and glioma cell lines. (A) TRIM31 protein levels in glioblastoma tissues compared with normal brain tissues. Magnification, x200; scale bar, 100 µm. (B) Western blot analysis of TRIM 31 protein expression levels in four different glioma cell lines and the NHA cell line. GAPDH was used as the loading control. (C) mRNA expression levels of TRIM31 in four different glioma cell lines and the NHA cell line. ***P<0.001 NHA cell line was compared to different gliomas cell lines separately. Data are presented as the mean ± standard deviation of three independent experiments. NC, negative control; NB, normal brain tissue; GBM, glioblastoma; TRIM31, tripartite motif-containing 31; NHA, normal human astrocytes.

