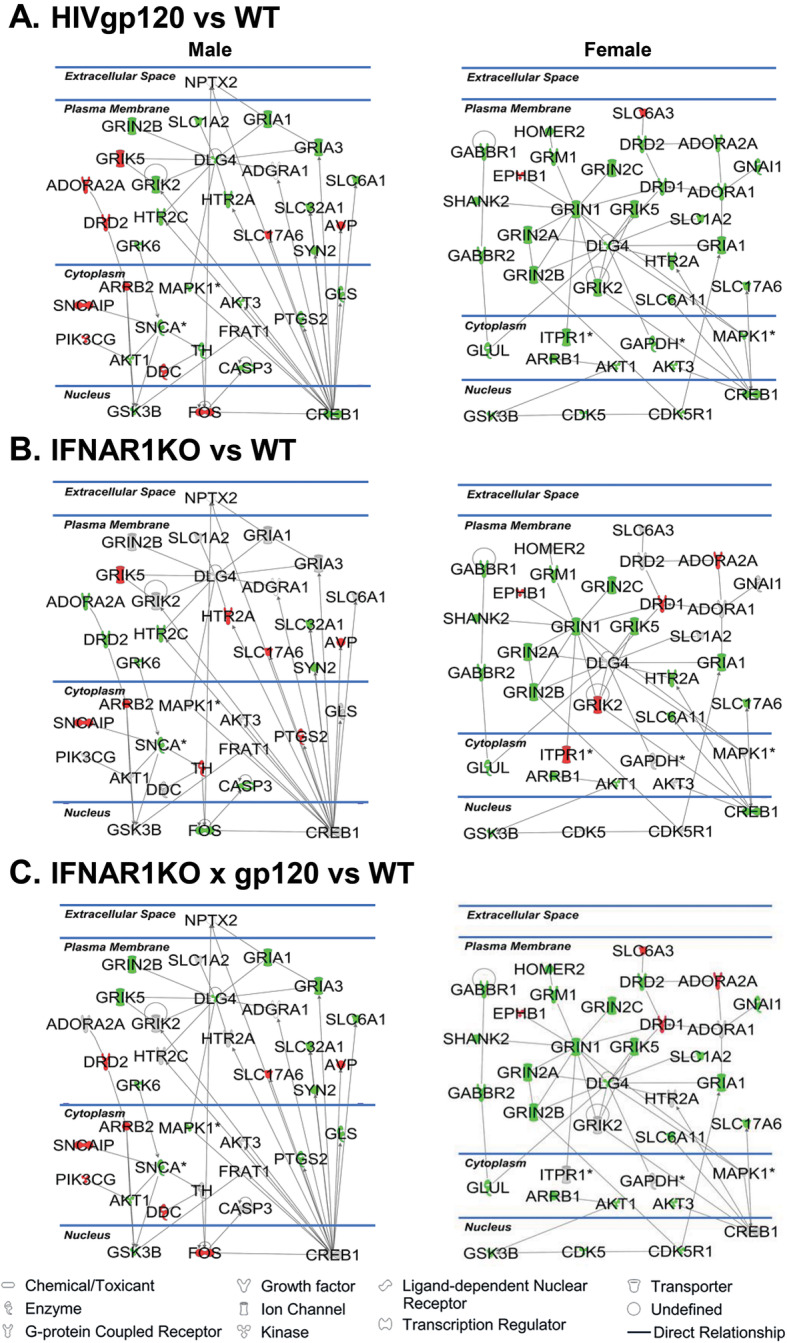
Fig. 7.

Functional neural gene networks of neurotransmission affected by HIVgp120 and IFNAR1 deficiency. RNA expression data obtained with the GABA/glutamate and dopamine/serotonin RT2 Profiler PCR Array were analyzed using IPA software. Green indicates downregulated while red reflects upregulated genes respectively. The components without color represent genes that were included by IPA without experimentally determined expression levels. IPA identified for each sex a different highest scoring gene direct interaction network in which alterations on expression levels were driven by HIVgp120 in the absence or presence of IFNAR1. The solid lines represent a direct relationship and the arrow indicates the direction of action. *Indicates genes for which differential regulation reached significance in the RT2 Profiler PCR Array (*P < 0.05; modified t test). RNA expression data were derived from n = 6 animals (3 males and 3 females) per group/genotype (total n = 24 animals)
