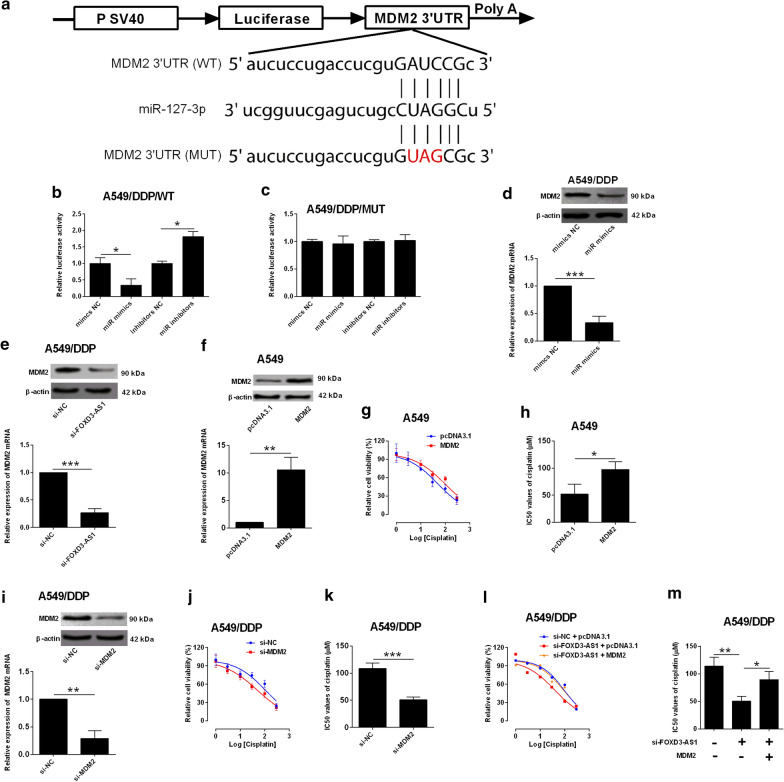
Fig. 3.
MiR-127-3p repressed MDM2 expression in NSCLC cells. a Predicted binding sites between miR-127-3p and MDM2 3′UTR. WT = wild type; MUT = mutated. b, c Dual-luciferase reporter assay analysis of relative luciferase activity of reporter vector containing wild type or mutated MDM2 3′UTR in A549/DDP cells with mimic NC, miR mimics, inhibitors NC or miR inhibitors transfection. d qRT-PCR and western blot analysis of MDM2 expression in A549/DDP cells with mimics NC or miR mimics transfection. e qRT-PCR and western blot analysis of MDM2 expression in A549/DDP cells with si-NC or si-FOXD3-AS1 expression. f qRT-PCR and western blot analysis of MDM2 expression in A549 cells with pcDNA3.1 or pcDNA3.1-MDM2 transfection. g, h CCK-8 assay analysis of IC50 values (cisplatin) in A549 cells with pcDNA3.1 or pcDNA3.1-MDM2 transfection. i qRT-PCR and western blot analysis of MDM2 expression in A549/DDP cells with si-NC or si-MDM2 transfection. j, k CCK-8 assay analysis of IC50 values (cisplatin) in A549/DDP cells with si-NC or si-MDM2 transfection. l, m CCK-8 assay analysis of IC50 values (cisplatin) in A549/DDP cells after being transfected with different oligonucleotides. Mimics NC = negative control for miR-127-3p mimics; miR mimics = miR-127-3p mimics; inhibitors NC = negative control for miR-127-3p inhibitors); miR inhibitors = miR-127-3p inhibitors. N = 3 biological samples, and each sample was assayed in triplicates. Significant differences between groups were shown as *P < 0.05, **P < 0.01 and ***P < 0.001

