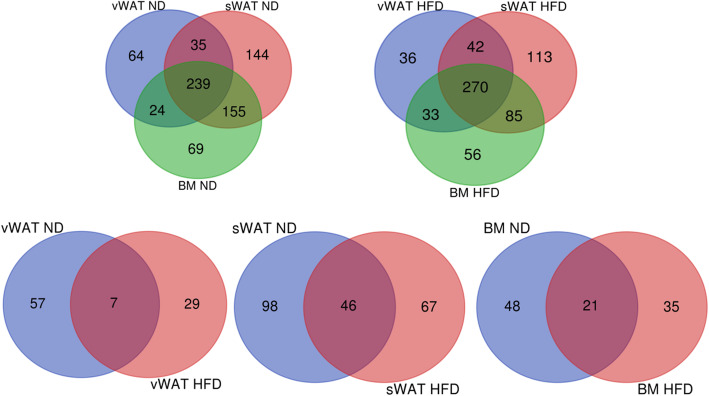
Fig. 5.
Venn diagram analysis. Top left: Venn diagram showing common and specific proteins among secretomes obtained from vWAT-MSCs, sWAT-MSCs, and BM-MSCs isolated from samples taken from normal mice (ND). Top right: Venn diagram showing common and specific proteins among secretomes obtained from vWAT-MSCs, sWAT-MSCs, and BM-MSCs isolated from samples taken from obese mice (HFD). Bottom: Venn diagram comparison of vWAT-MSCs from normal mice with vWAT-MSCs from obese mice. The same procedure was applied for sWAT-MSCs and BM-MSCs. Numbers indicate common and specific proteins for every comparison

