Fig. 4.
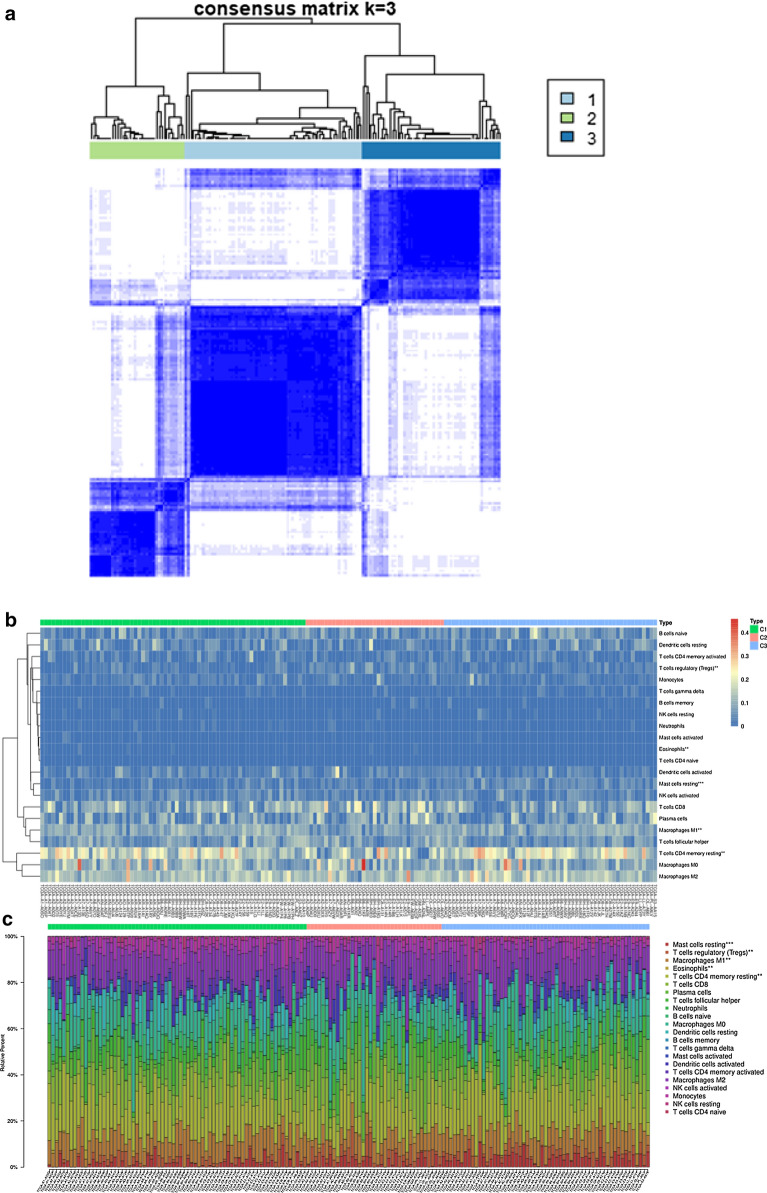
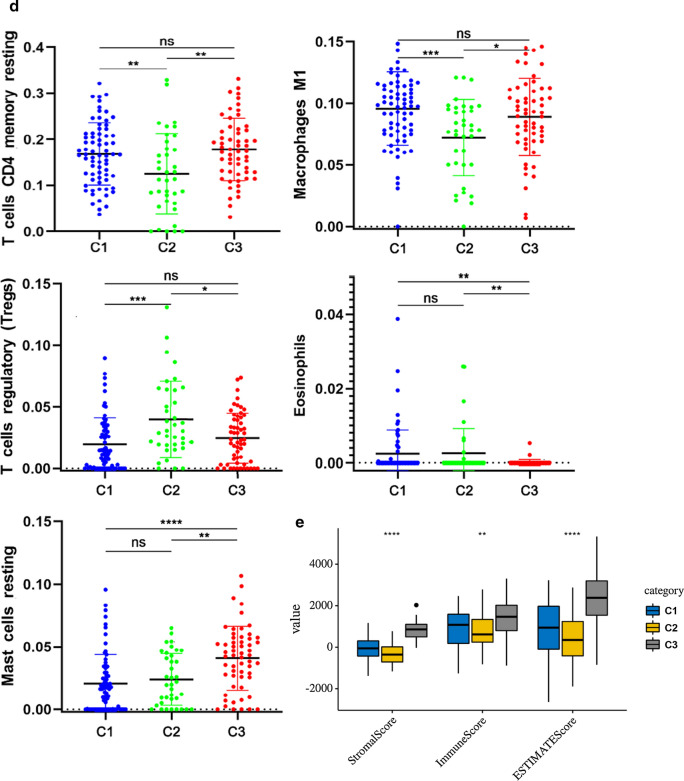
CAAS-based clusters significantly associated with immune microenvironment features (CIBERSORT P > 0.05). a Consensus clustering analysis identification of three clusters (samples, n = 165. The white (consensus value = 0, samples never clustered together) and blue (consensus value = 1, samples always clustered together) heatmap colours display sample consensus. b Heatmap of CAASs ordered by clusters showing differential expression of immune cells between patients. c Heatmap of CAASs ordered by clusters displaying the distribution of immune cells in each patient. The asterisk in the upper right corner of the immune cells indicates that the differential expression is significantly different. “*” represents P < 0.05; “**” represents P < 0.01; “***” represents P < 0.001. d A demonstration of the specific expression of differentially expressed immune cells in clusters according to Fig. 4b and c. e Immune score and stromal score between CAAS-based clusters


