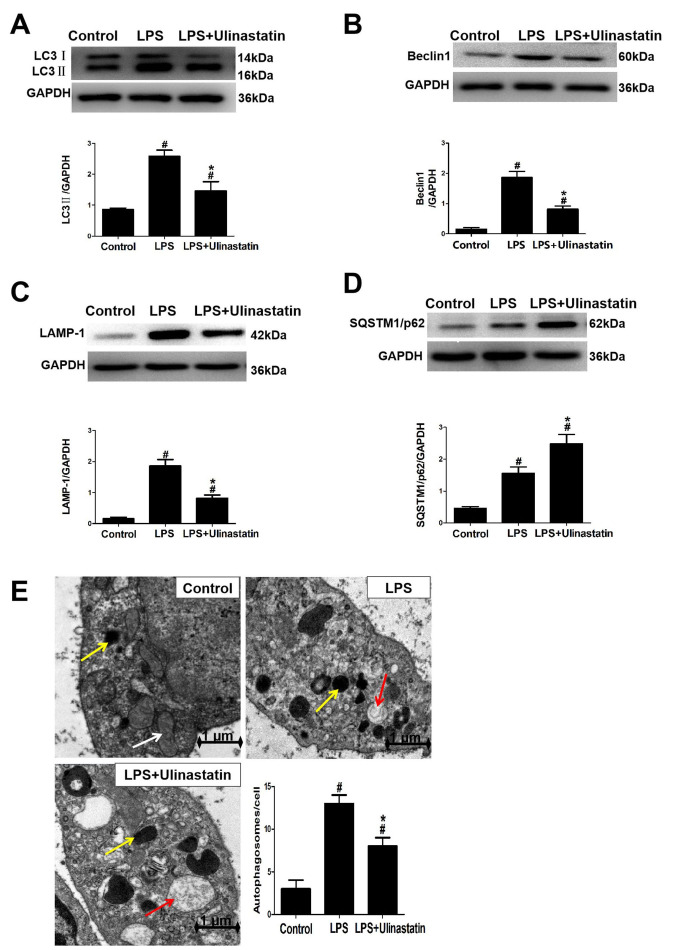
Figure 4.
Effects of ulinastatin on autophagy in mice with endotoxemia. LPS-induced endotoxemia mice were treated with saline or ulinastatin, and the left ventricle tissues were collected 12 h later for analysis. Western blotting was used to analyze the protein expression levels of (A) LC3II, (B) Beclin 1, (C) LAMP-1 and (D) SQSTM1/p62 in the myocardial tissues. GAPDH was used as a loading control. (E) Transmission electron microscopy was used to observe the number of autophagosomes formed in the cardiac tissue. Magnification x30,000. Scale bar, 1 µm. Yellow arrow indicates the autophagosomes, the white arrow indicates the mitochondria and the red arrow indicates the lysosomes. Data are presented as the mean ± SEM. Data were compared using a one-way ANOVA, followed by a Student-Newman-Keuls post hoc test. #P<0.05 vs. control group; *P<0.05 vs. LPS group. LPS, lipopolysaccharide; LC3, microtubule-associated protein light chain 3; LAMP, lysosomal-associated membrane protein 1; SQSTM1, sequestosome-1.

