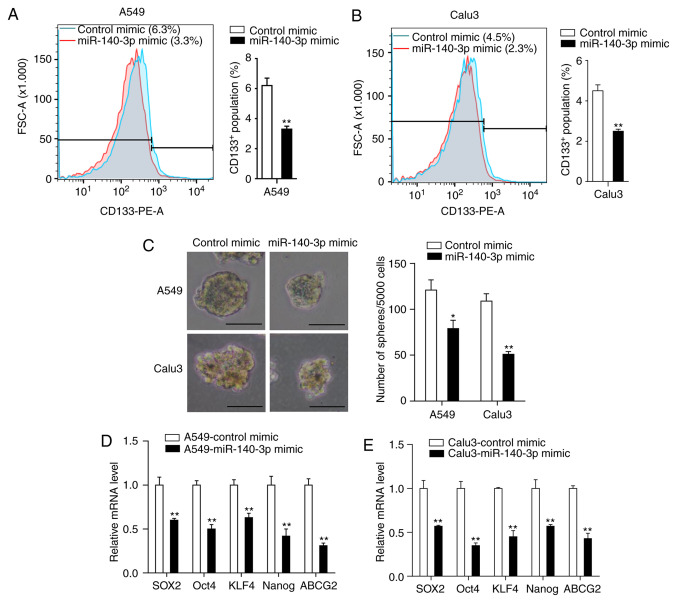
Figure 3.
miR-140-3p attenuates the stem cell-like properties of LUAD cells. The percentage of CD133+ cells in (A) A549 and (B) Calu3 cells was analyzed by flow cytometry. (C) Representative images and the number of spheres with diameter >100 µm formed of A549 and Calu3 cells following transfection with miR-140-3p or the control mimic. mRNA expression levels of SOX2, OCT4, KLF4, NANOG and ABCG2 in (D) A549 and (E) Calu3 cells following transfection with miR-140-3p or the control mimic. Data are represented as the mean ± standard deviation from three independent experiments. *P<0.05 and **P<0.01 vs. control mimic. Scale bar, 100 µm. miR, microRNA; LUAD, lung adenocarcinoma; CD133, cluster of differentiation 133; SOX2, SRY-Box 2; OCT4, Octamer-binding transcription factor 4; KLF4, Kruppel like factor 4; ABCG2, ATP binding cassette subfamily G member 2; PE, phycoerythrin; FSC, Forward versus side scatter.

