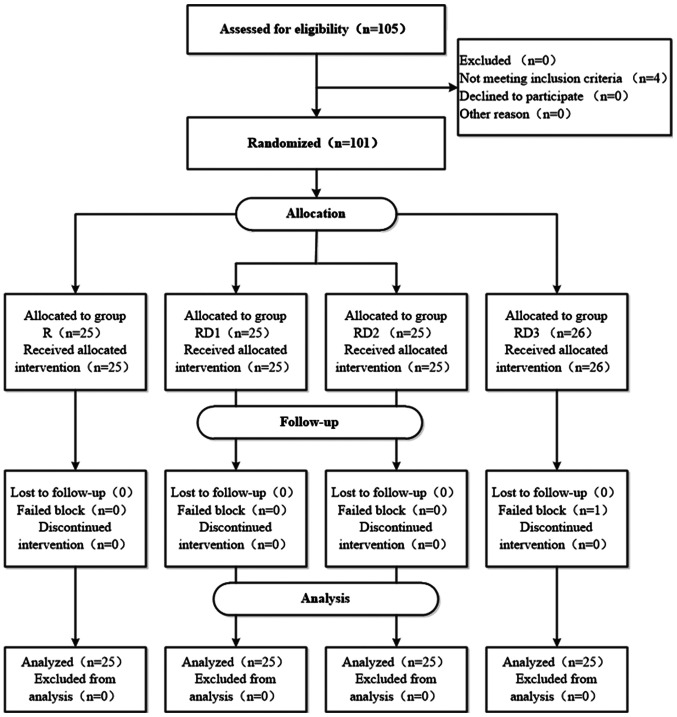
Figure 1.
Flow diagram demonstrating the number of patients at each phase of the study. R, TAP block with 0.3% ropivacaine; RD1, TAP block with ropivacaine and 0.5 µg/kg dexmedetomidine; RD2, TAP block with ropivacaine and 1 µg/kg dexmedetomidine; RD3, TAP block with ropivacaine and 2 µg/kg dexmedetomidine.

