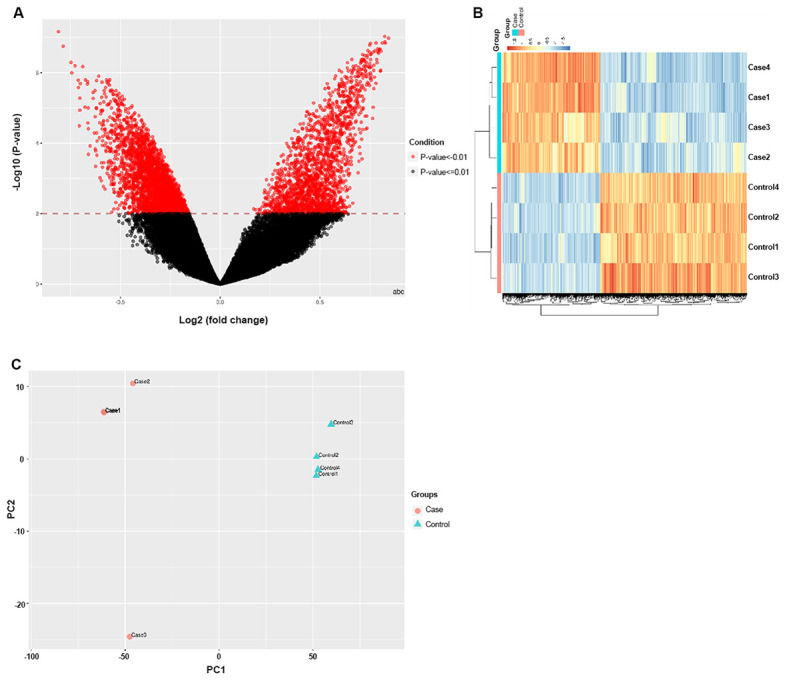
Figure 3.

Volcano, heat and PCA maps of the differences between the healthy control samples and the thoracic aortic dissection case samples. (A) Volcano plot of the methylome data indicating the differentially methylated regions between the cases and the controls. (B) Heat map of the differentially methylated CpG sites between the cases and the controls. The DNA methylation level is color-coded. Blue, CpGs with the lowest methylation levels; red, CpGs with the highest methylation levels. (C) Results of the PCA analysis of the two sets of samples. PCA, principal component analysis.
