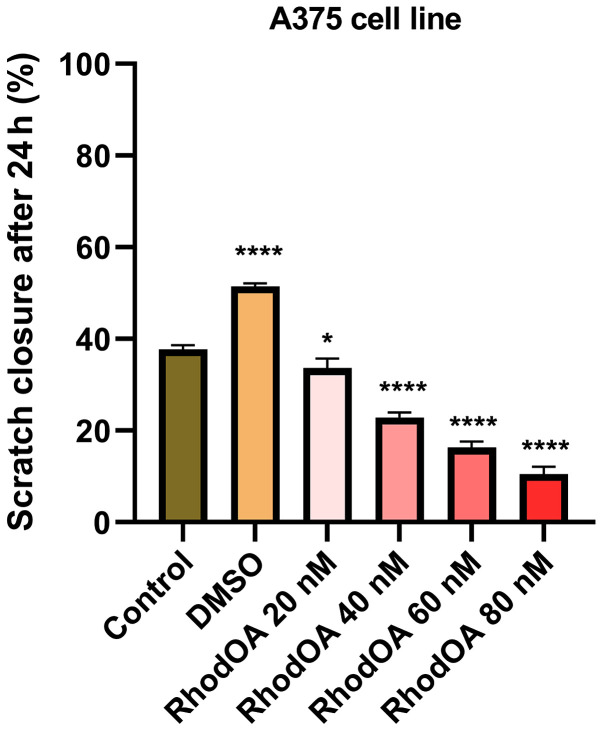
Figure 6.
Scratch closure rate of A375 following RhodOA treatment (20, 40, 60 and 80 nM). The graph shows the percentage of scratch closure after 24 h compared to the initial surface. The comparison between-groups was performed using One-way ANOVA test followed by Dunnett's post-test (*P<0.05; ***P<0.001 vs. control cells).

