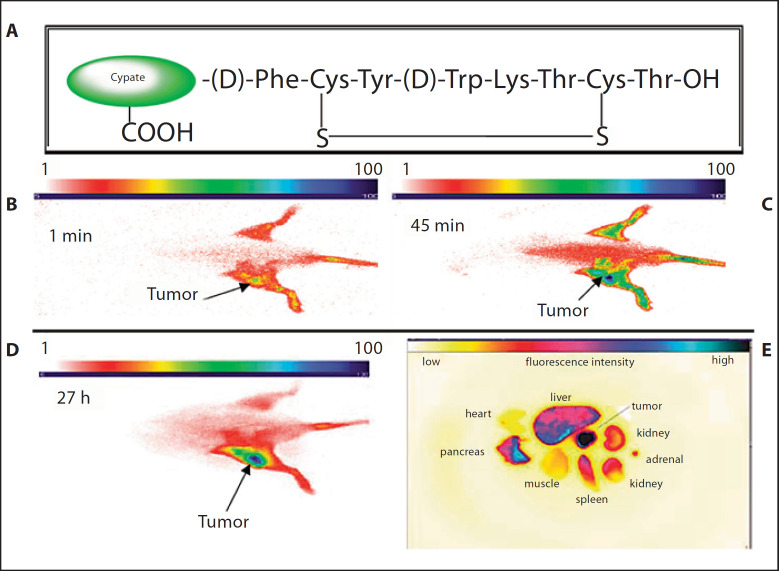
Fig. 10.
Structure of cypate-octreotate imaging agent (A) and fluorescence images of pancreatic tumor-bearing rat at 1 min (B), 45 min (C) and 27 h (D) after injection of the optical probe. Ex vivo fluorescence image of representative major organs (E) shows fluorescence intensity of excised organs tissue. Modified figure reprinted with permission from Achilefu [12].

