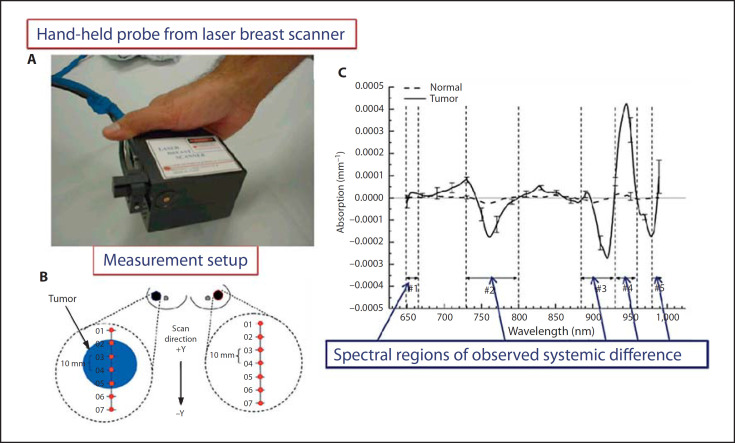
Fig. 3.
Optical spectroscopy for primary tumor imaging. A Hand-held probe from laser breast scanner in contact with the breast during data acquisition. B Measurement setup showing the points across line scan. C Graph showing average tumor-specific component-based biochemical and physical property changes such as hemoglobin, oxyhemoglobin, water, and bulk lipid. Reprinted with permission from Kukreti et al. [72].

