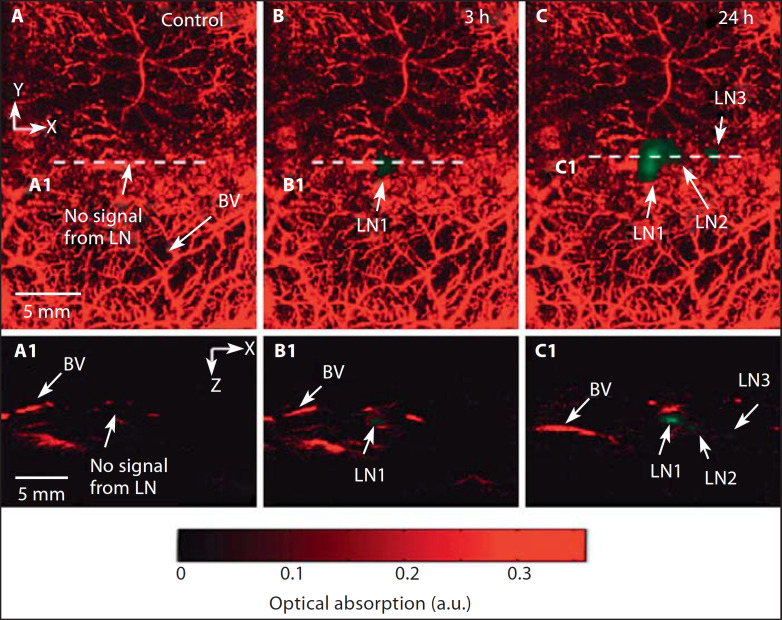
Fig. 7.
In vivo PAI and ultrasound imaging of fluorescent sentinel lymph node. A Control image acquired before injection of nanoparticles. B Photoacoustic image at 3 h after injection. C Photoacoustic image at 24 h after injection. A1, B1, C1 B-scan images along the cuts A1, B1 and C1, respectively. Reprinted with permission from Akers et al. [100].

