
FIGURE 2.
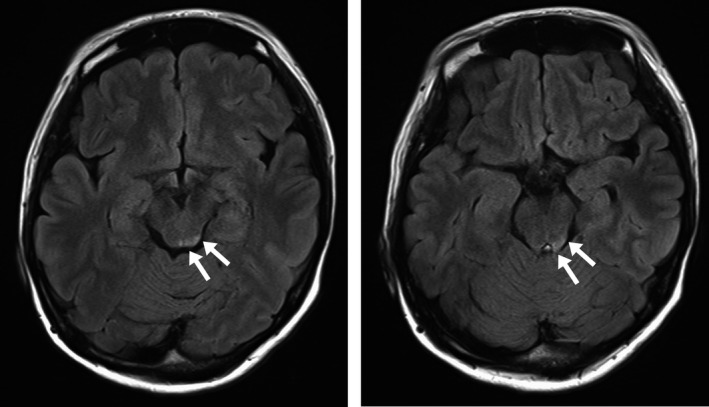
Brain magnetic resonance imaging. T2‐weighted images revealed slightly high attenuation around the inferior colliculus of the midbrain on the left side (arrows)
Official websites use .gov
A
.gov website belongs to an official
government organization in the United States.
Secure .gov websites use HTTPS
A lock (
) or https:// means you've safely
connected to the .gov website. Share sensitive
information only on official, secure websites.
Brain magnetic resonance imaging. T2‐weighted images revealed slightly high attenuation around the inferior colliculus of the midbrain on the left side (arrows)