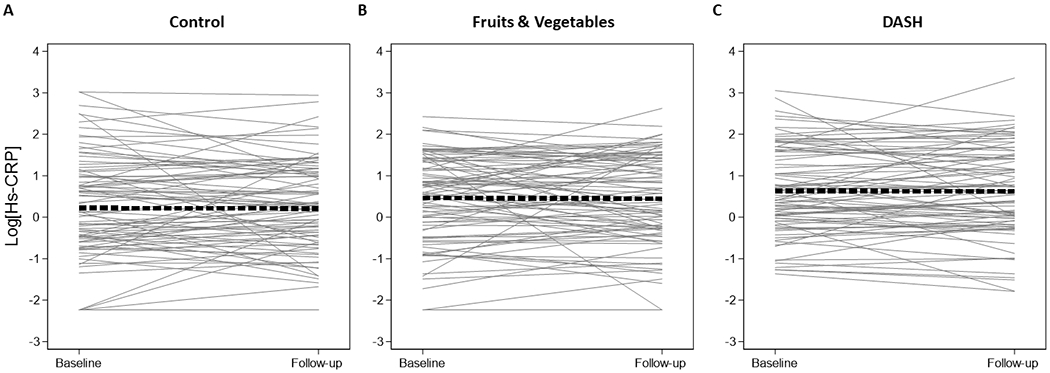
Figure 4.

Spaghetti plots of high sensitivity C-reactive protein
Legend: Spaghetti plots of the within person change in natural log-transformed high sensitivity C-reactive protein (mg/L) at baseline and the follow-up visit after 8-weeks. These plots are limited to the 257 participants with both baseline and follow-up measurements. Panel A represents those assigned to the control diet (N=85), panel B represents those assigned to the fruits & vegetables diet (N=86), and panel C represents those assigned to the DASH diet (N=84). The thick dashed line represents the average slope and intercept.
