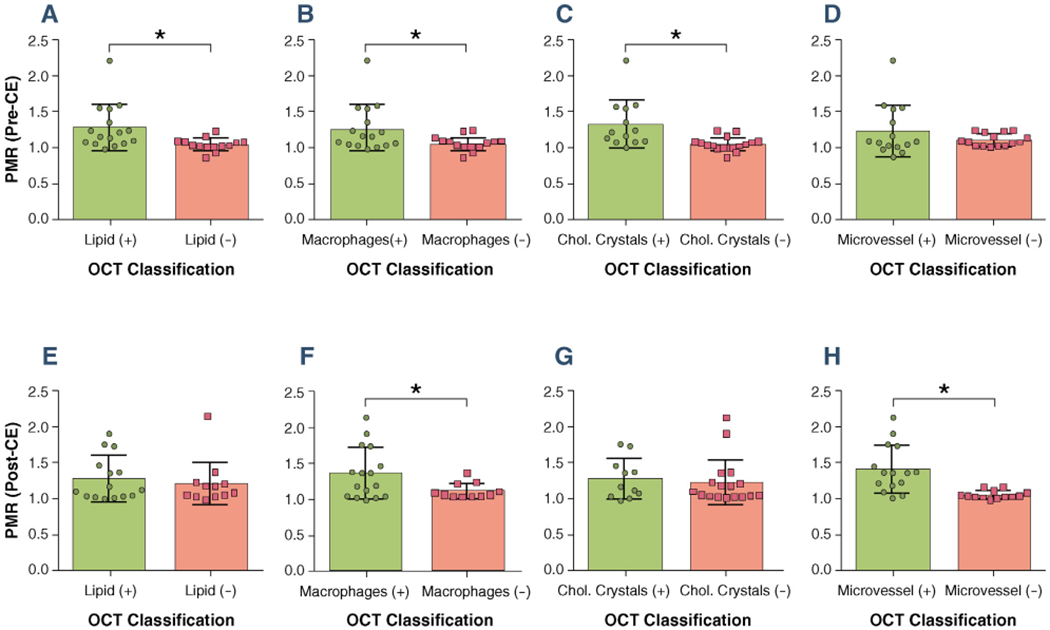
FIGURE 5. Relationship Between PMR and OCT Classifications.

Coronary plaques with high-risk features as classified by optical coherence tomography (OCT) tended to be hyperintensive on coronary atherosclerosis T1-weighted characterization with integrated anatomical reference images. (A to D) Pre-contrast plaque to myocardium signal ratio (PMR) versus OCT classifications. (E to H) Post-contrast PMR versus OCT classifications. Error bars represent standard deviation. Positive sign (+) and negative sign (−) denote lesion groups with corresponding OCT grading. Star signs (*) denote statistical significance (p < 0.05). CE = contrast enhancement; Chol. = cholesterol.
