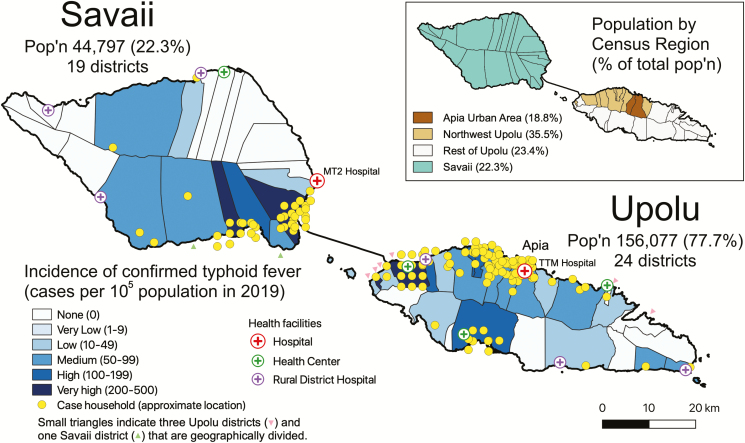
Figure 4.
Map showing the incidence and geographical distribution of households of cases of blood culture-confirmed typhoid fever occurring in 2019 in Samoa. Incidence (cases per 105 population) is represented by variable shading from white to dark blue, with darker hues representing higher incidence ranges. Each yellow dot approximates index case(s) of typhoid within a household to portray the density of cases. To maintain patient confidentiality, a mapping program randomly displaced the marker slightly on the map. Households of all cases were visited by a Samoa Typhoid Epidemiologic SWAT Team that recorded GPS coordinates with a Garmin GPSMAP 64SC. The insert shows the Apia Urban Area and 3 rural regions—Northwest Upolu, Rest of Upolu, and Savaii—with the percent of the 2019 population in parentheses. Upolu’s population of 156 077 comprises 77.7% of the total population of Samoa, whereas Savaii’s population of 44 797 comprises 22.3% of the total population. Mapping and point displacement were performed using QGIS 3.8.0-Zanzibar (QGIS Development Team, QGIS Geographic Information System, Open Source Geospatial Foundation Project, http://qgis.osgeo.org).

