
4.
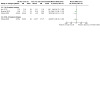
Forest plot of comparison: 1 No tea tree oil group versus tea tree oil (intervention) group, outcome: 1.2 Mean change in (or mean) participant‐reported symptoms.
Official websites use .gov
A
.gov website belongs to an official
government organization in the United States.
Secure .gov websites use HTTPS
A lock (
) or https:// means you've safely
connected to the .gov website. Share sensitive
information only on official, secure websites.
Forest plot of comparison: 1 No tea tree oil group versus tea tree oil (intervention) group, outcome: 1.2 Mean change in (or mean) participant‐reported symptoms.