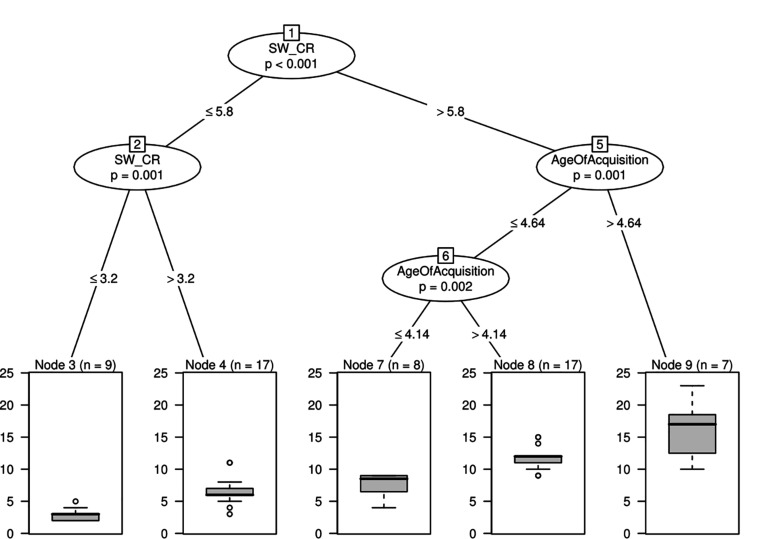
FIGURE 1.
Conditional inference tree with switches and age of acquisition as relevant variables. Conditional inference tree representing how variables interact. Each circle or box represents a node. The number of each node is written on top of the circle or box. Nodes represented with circles show variables that are significantly associated with different distributions of the value of the dependent variable, total number of words, and include a p-value. Below each circle, the values indicate a point in each variable where individuals split into those groups. The nodes represented by boxes are the terminal nodes, which describe a subsection of the sample that corresponds to that split in the data and provides a plot representing the distribution of the data for each subsection of the sample. SW_CR, Switches Correct.

