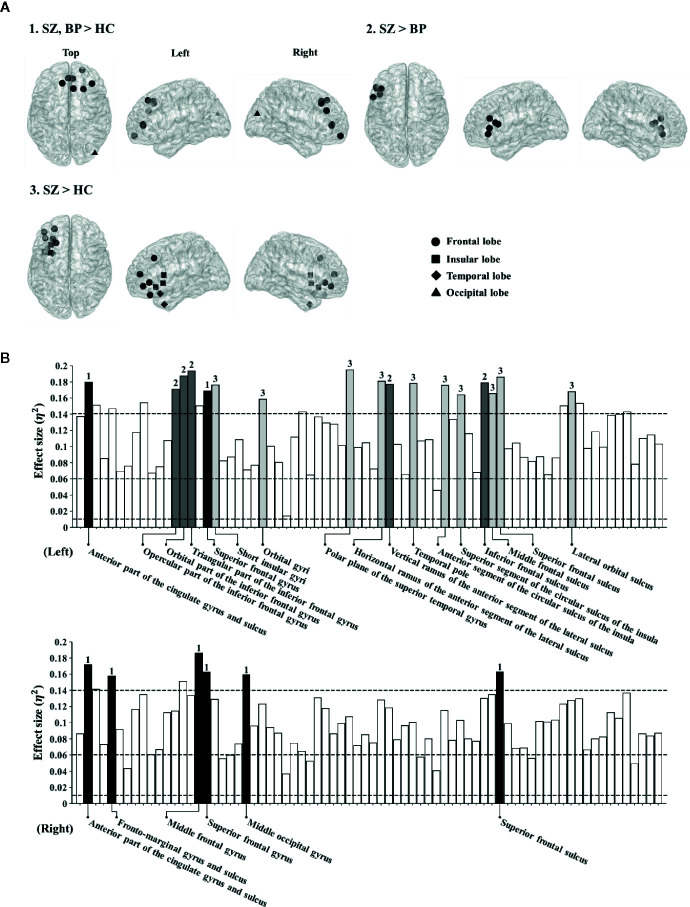
Figure 1.
(A) Brain regions showing significantly different nodal clustering coefficients (CCs) of the theta frequency band among patient groups and healthy controls. (B) Effect sizes of differences in nodal CCs of the theta frequency band among patient groups and healthy controls. Each bar indicates the effect size at each node. The upper bars indicate 74 regions in the left hemisphere and the lower bars indicate 74 regions in the right hemisphere. For reference, three dotted lines are drawn for small (0.01), medium (0.06), and large (0.14) effect sizes. The bars with numbers reveal significant differences among patient groups and the healthy controls (The p-value was adjusted via Bonferroni correction with 0.05/148 = 0.000338). The number “1” denotes brain regions where patient groups show significant differences from healthy controls. The number “2” denotes brain regions where patients with schizophrenia show significant differences from those with bipolar disorder. The number “3” denotes brain regions where patients with schizophrenia show significant differences from healthy controls.

