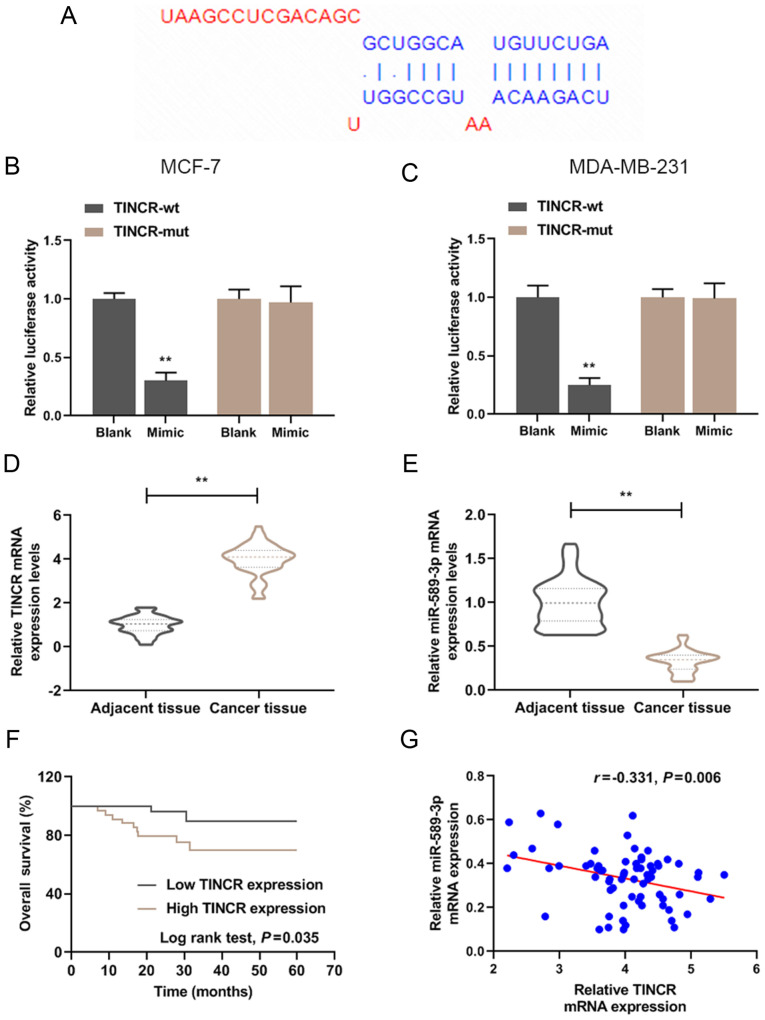
Figure 1.
TINCR was highly expressed in breast cancer tissues and was negatively correlated with miR-589-3p expression level. (A) TINCR targeting miRNA was predicted by StarBase. (B and C) Luciferase activity of TINCR in miR-589-3p mimic group was detected by luciferase assay. **P<0.01 vs. blank. (D) RT-qPCR was used to detect TINCR expression level in breast cancer and adjacent tissues (n=68). GAPDH was used as the internal reference. (E) RT-qPCR was used to detect miR-589-3p expression level in breast cancer and adjacent tissues (n=68). U6 was used as the internal reference. **P<0.01 vs. adjacent tissues. (F) Kaplan-Meier curve analysis of the 5-year survival curve of all patients with breast cancer (n=68). (G) Correlation between TINCR and miR-589-3p expression levels. All experiments were repeated three times. miR, microRNA; mut, mutant; RT-qPCR, reverse transcription-quantitative PCR; TINCR, tissue differentiation inducing non-protein coding RNA; wt, wild type.

